
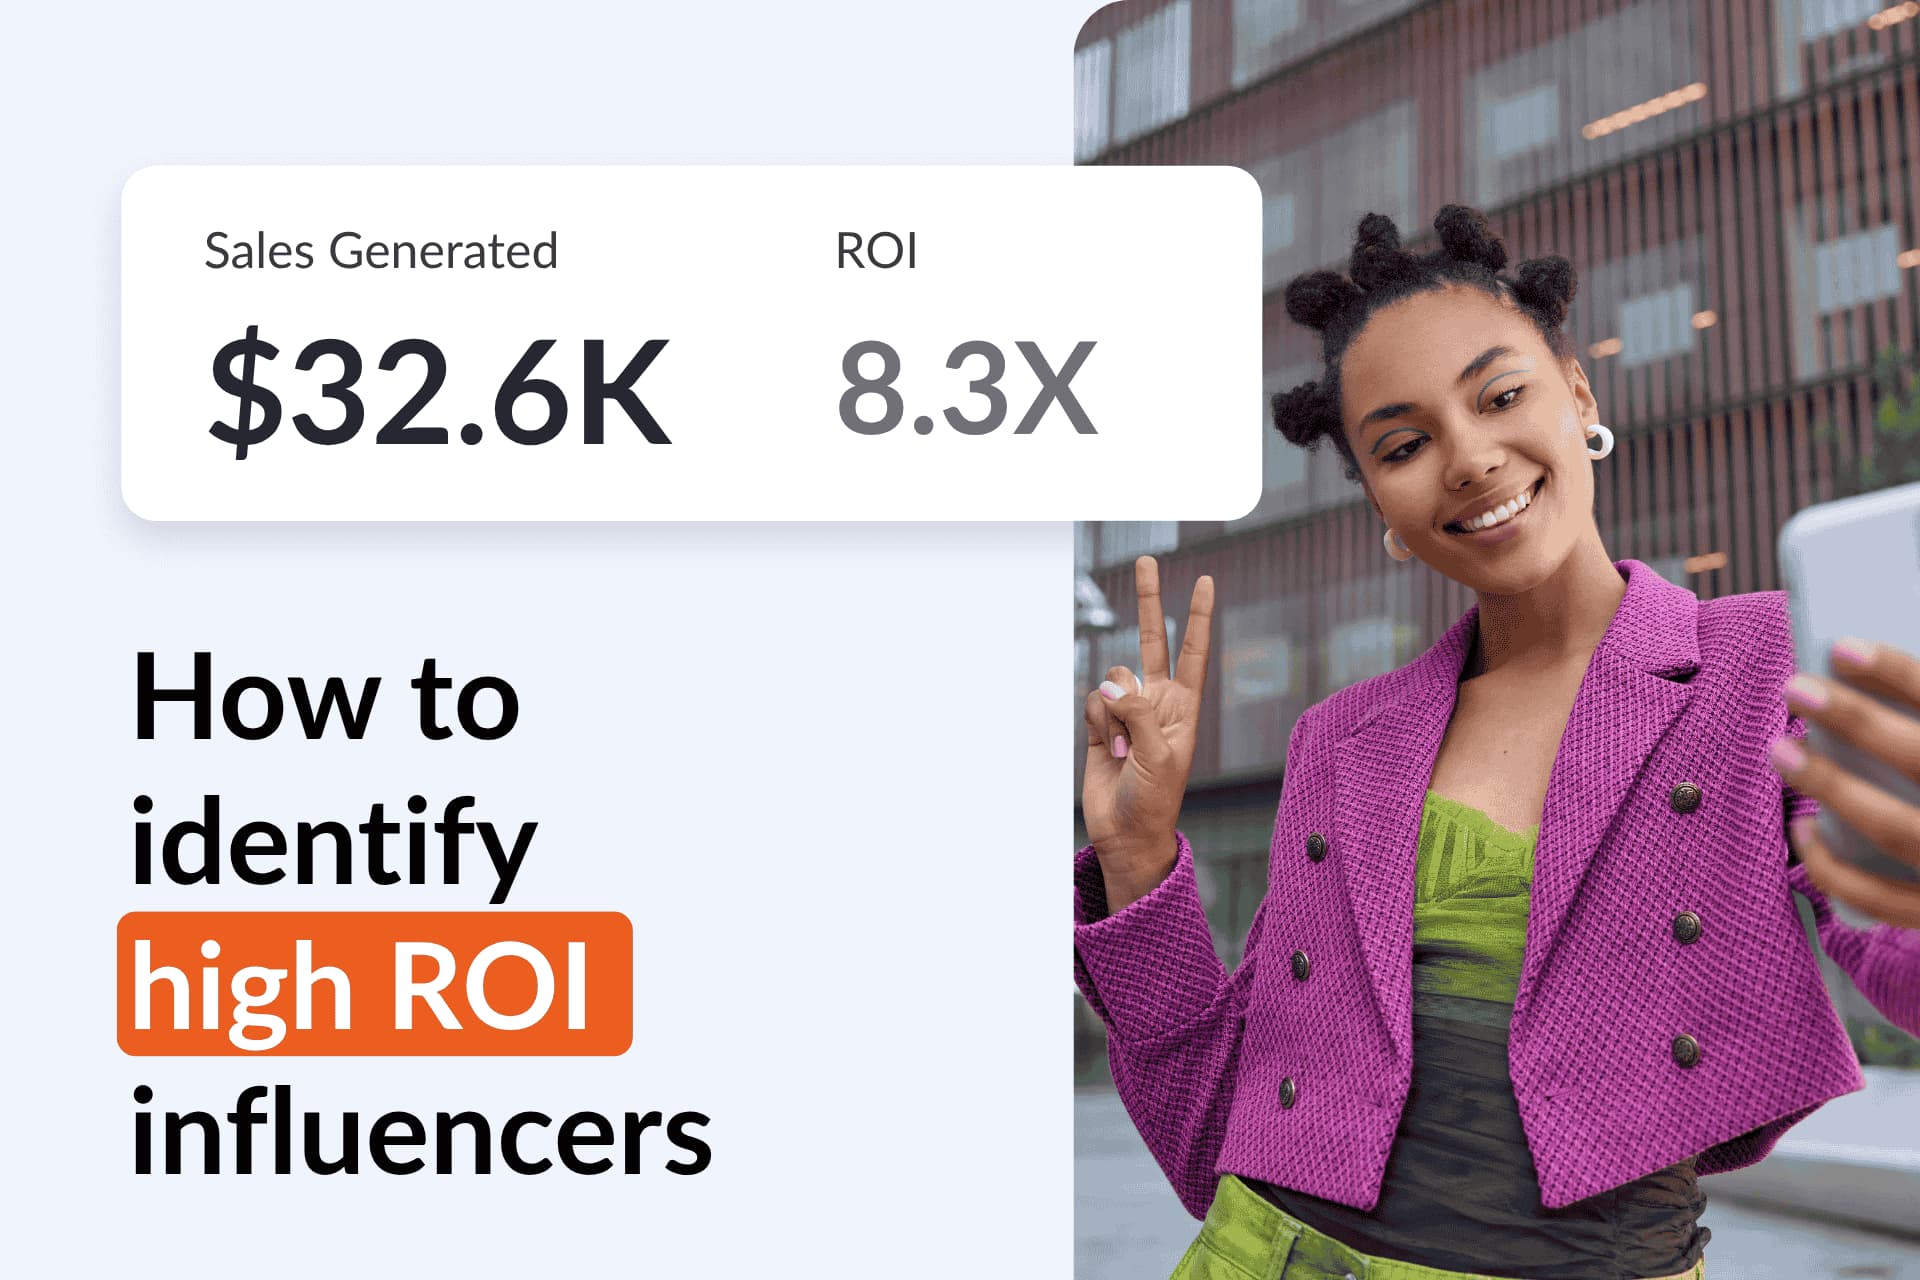
Influencer Reporting & Analytics: Mida el Rendimiento y los Resultados de la Campaña

March 27, 2026
|
Publicado

May 28, 2026
|
Actualizada

13 Min
|
Lectura
Curso de marketing de resultados para influencers | Cupón: IMC100

María Vincenzini
| Author

Impulse el ROI con Influencers

Base de datos global de influencers
Plataforma TODO EN UNO
CRM, afiliados, UGC y más
Informes y Analítica de Influencers: Mida el Desempeño y Resultados de Campañas
Ya sea que esté haciendo la transición desde hojas de cálculo manuales o buscando refinar una estrategia existente, entender sus datos es la clave para mejorar el ROI. Este artículo está diseñado para mostrarle exactamente cómo funciona la nueva función Informes y Analítica de Influencers dentro de Influencer Hero y cómo puede utilizarla para convertir datos de campañas en crecimiento accionable.
El conjunto de Informes y Analítica es un centro de comando completamente rediseñado en tiempo real que le brinda visibilidad total sobre sus campañas a través de pestañas de datos especializadas. Al conectarse directamente con su CMS de comercio electrónico, cierra la brecha entre el compromiso social y los resultados empresariales, rastreando todo desde alcance y clics hasta ventas afiliadas, desempeño de alcance, y costos de inventario (COGS) en un solo lugar.
¿Listo para ver cómo funciona en la práctica? Sumerjámonos y veamos cómo puede aprovechar al máximo estas herramientas mejoradas para identificar sus próximos socios con mejor desempeño y escalar sus resultados.
Cómo Funcionan los Informes y Analítica en Influencer Hero
Piense en el conjunto de Informes y Analítica como el motor de ROI de su programa de influencers. Mientras que otras herramientas se enfocan en el "quién" y el "cómo", esta función responde la pregunta esencial: ¿"Esta campaña realmente está funcionando?" Va más allá de los me gusta superficiales para demostrar el valor empresarial tangible de cada asociación, ya sea que esté ejecutando programas afiliados a gran escala o campañas de conciencia de marca dirigidas.
Se comporta como una auditoría automatizada de toda su campaña, extrayendo datos directamente de plataformas sociales y su tienda de comercio electrónico para que nunca tenga que calcular manualmente una conversión nuevamente. La interfaz recién rediseñada ahora categoriza estos datos en pestañas especializadas—General, UGC, Escucha Social y Alcance—para una vista más granular de su embudo.
Paso 1: Navegación del Panel de Desempeño y Pestañas Especializadas
Cuando entra en la sección de Informes, se enfrenta a un panel completamente renovado diseñado para actuar como el centro de comando de su campaña. Esta interfaz se divide en un resumen de alto nivel y pestañas especializadas dedicadas para darle una vista clara de su embudo en cada etapa.
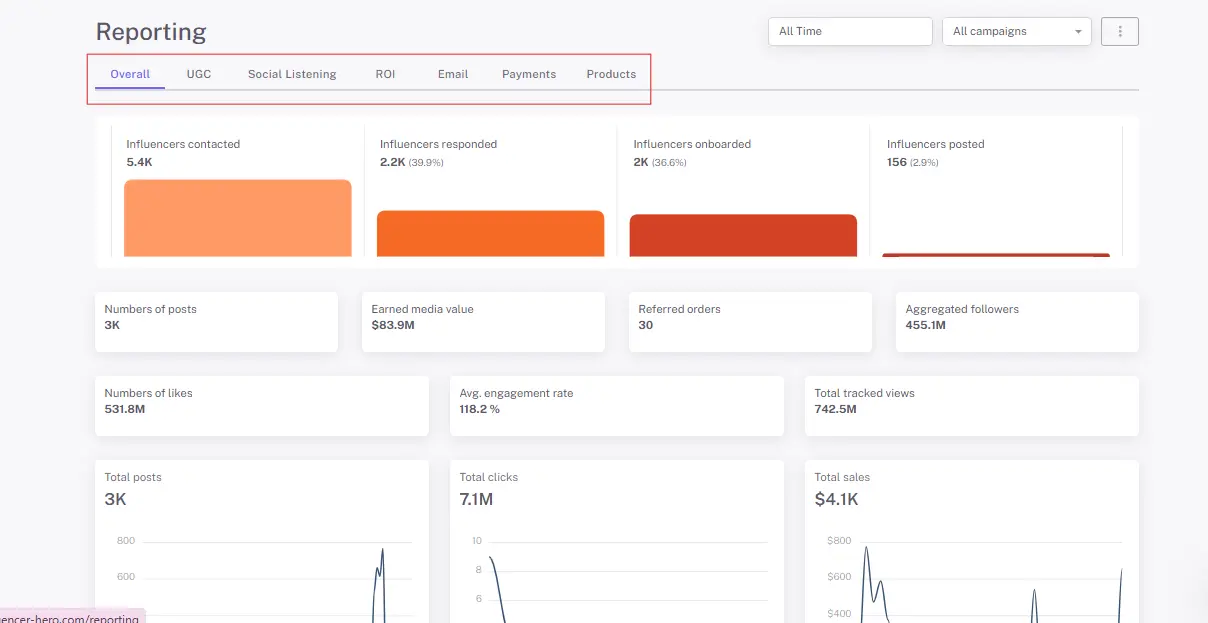
La Pestaña "General": Su Resumen Rápido de Desempeño
La pestaña General proporciona una impresión general de cómo está funcionando su campaña. Agrega datos de toda la plataforma—incluyendo UGC, escucha social, ROI e informes de correo electrónico—para darle una instantánea de su alcance e impacto total.
- Informes Dinámicos por Rango de Fechas: Ahora puede filtrar por fechas específicas, asegurando que los pedidos remitidos y datos de ventas solo muestren lo que ocurrió dentro de esa ventana específica para una precisión del 100%.
- Visualización de Embudo: Vea el recorrido completo desde el número total de influencers contactados hasta el número de pedidos remitidos.
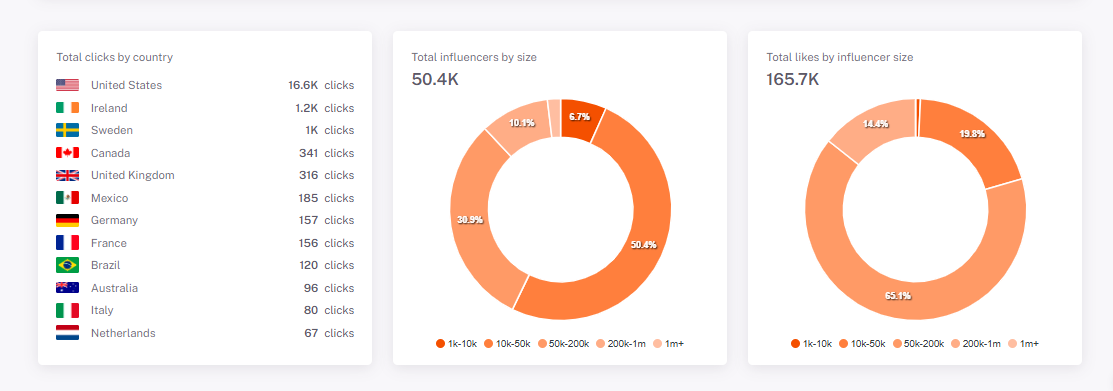
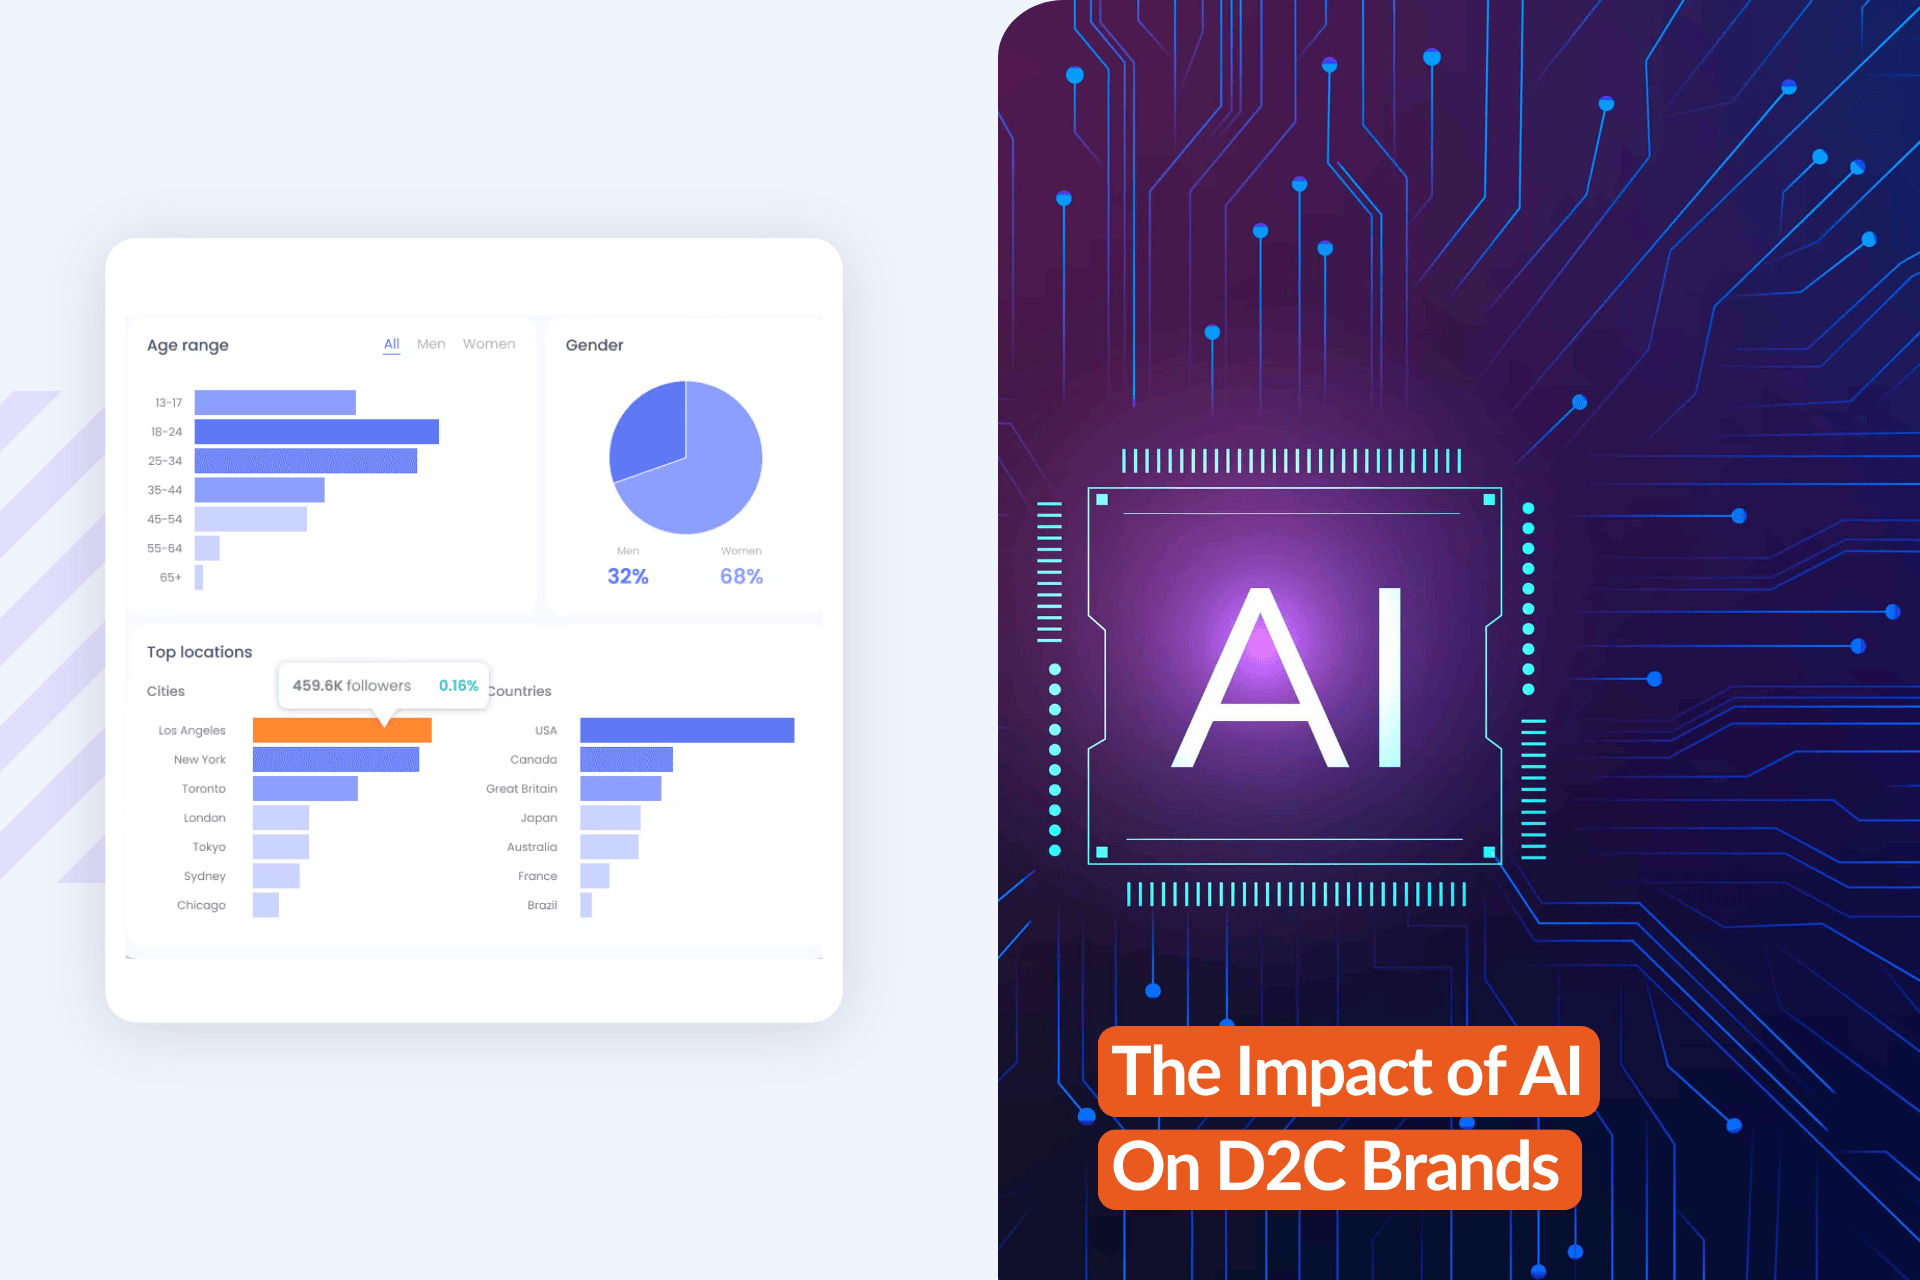
- Gráficos de Compromiso: Utilice datos visuales como "Influencers Totales por Tamaño" y "Me Gusta Totales por Tamaño" para identificar qué rangos de seguidores (Nano vs. Mega) están impulsando sus mejores resultados.
Análisis Profundo de Pestañas Especializadas
Para obtener información más detallada, puede navegar entre pestañas especializadas que se enfoquen en áreas específicas de su estrategia:
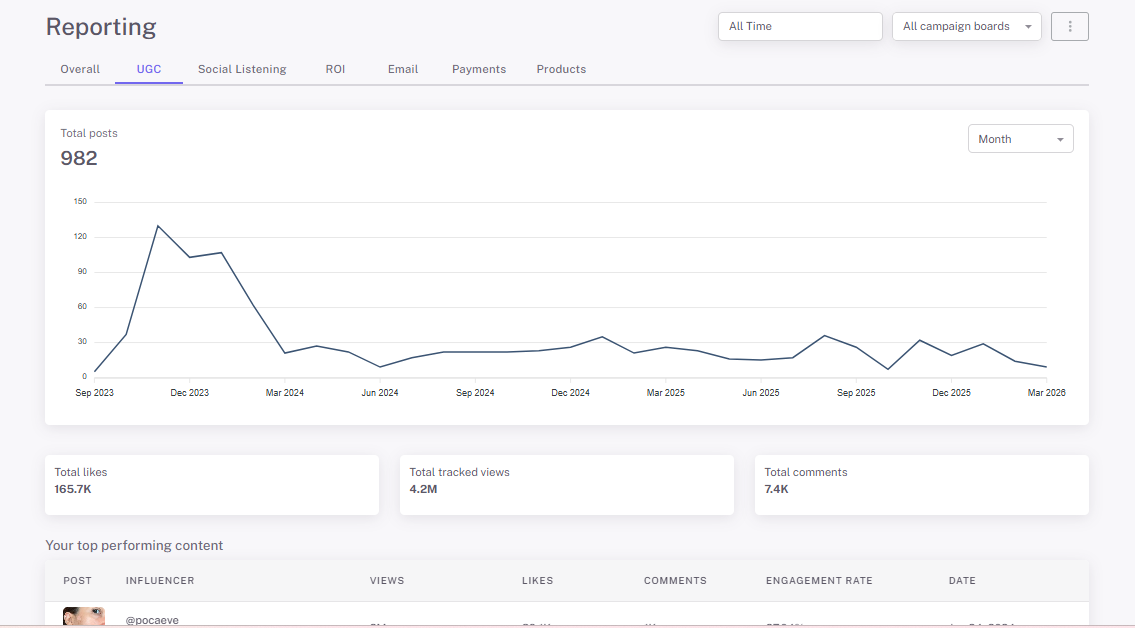
- Pestaña UGC: Esta sección rastrea cada publicación recopilada e identifica su Contenido con Mejor Desempeño. Destaca qué publicaciones específicas generaron más vistas, me gusta y comentarios, permitiéndole ver exactamente
- Escucha Social: Esta pestaña rastrea el contenido "etiquetado", mostrándole quién está hablando sobre su marca de forma orgánica fuera de sus contactos formales de campaña.
- ROI y Ventas: Aquí es donde rastrea el impacto financiero, incluyendo Valor de Medios Ganados (EMV) y ventas totales por plataforma. Extrae datos directamente de su Webflow o tienda de eCommerce para mostrar ingresos en tiempo real.
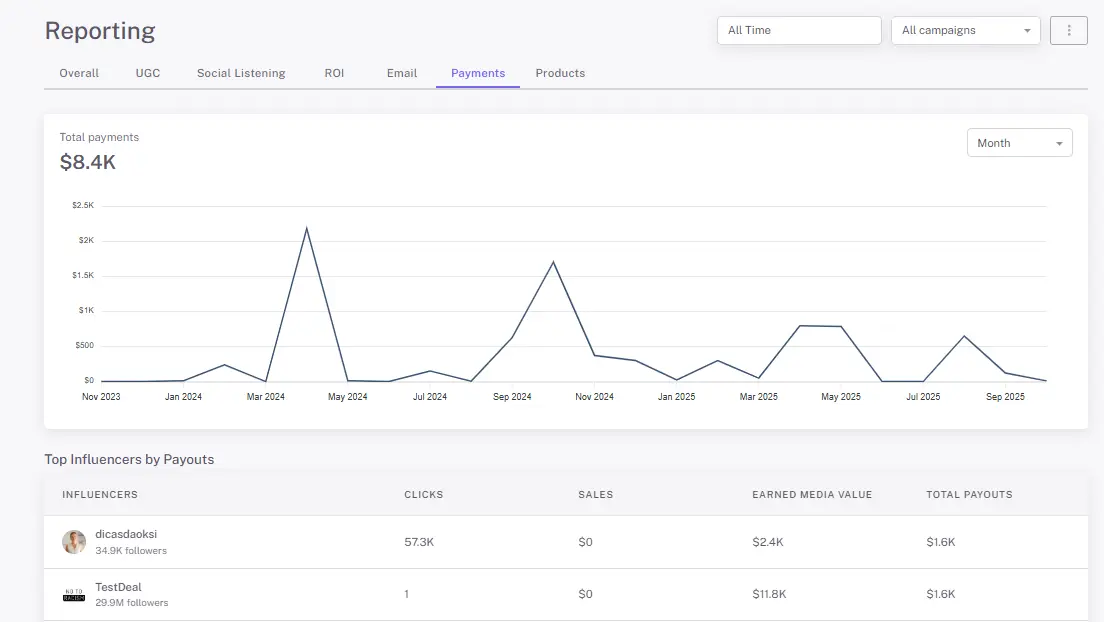
- Pestaña de Pagos: Su libro mayor financiero para la compensación de creadores. Esta pestaña centraliza los estados de pago, facturas pendientes y seguimiento de comisiones, asegurando que su equipo se mantenga organizado y los creadores se paguen de forma precisa y puntual.
- Pestaña de Productos: El centro logístico de su estrategia de gifting. Rastrea el inventario de productos enviados a influencers, monitorea el estado del cumplimiento a través de su integración de eCommerce e identifica qué productos específicos generan el mayor compromiso social.
Paso 2: Clasificación de sus mejores desempeños y escucha social
Este paso le permite ir más allá de la salud general de la campaña para responsabilidad individual analizando el desempeño específico del contenido y el alcance orgánico.
- Pestaña UGC (Contenido con mejor desempeño): Esta sección identifica automáticamente su Contenido con mejor desempeño basándose en métricas de compromiso como likes y comentarios. Puede ver rápidamente los tres principales posts que tienen mejor desempeño, facilitando compartir historias de éxito con clientes o partes interesadas para mantenerlos comprometidos.
- Pestaña de Escucha Social: Esta pestaña rastrea el contenido "etiquetado" donde su marca fue mencionada por influencers que no están actualmente en su CRM. Ayuda a capturar el efecto "halo" orgánico de su marca y proporciona información sobre quién más está hablando de usted en línea, incluso si no forman parte de sus esfuerzos de divulgación formal.
Paso 3: Optimización del gifting y reclutamiento
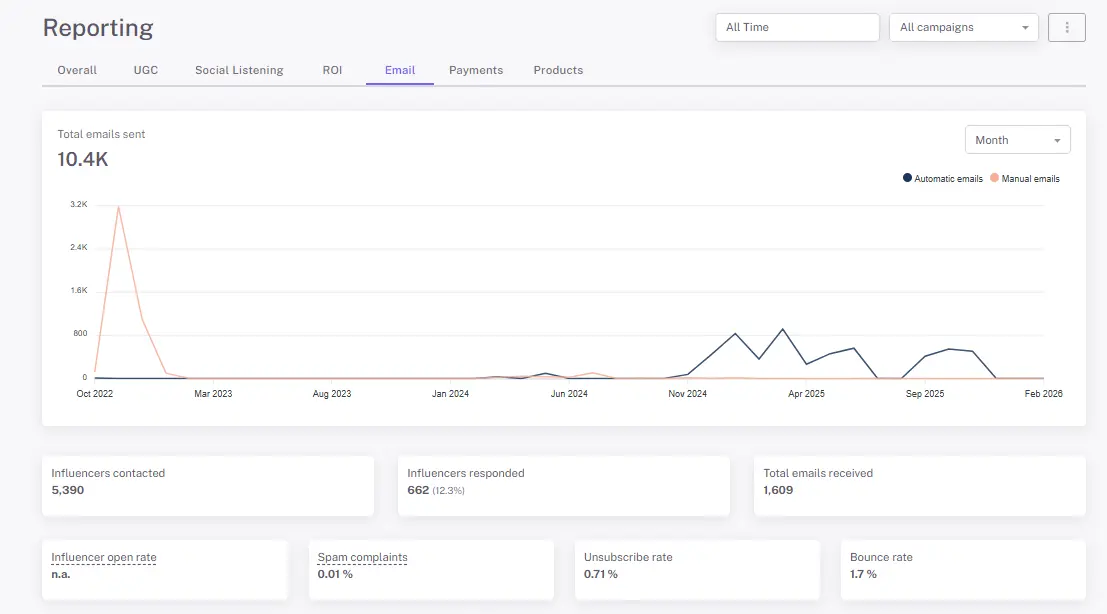
Una actualización importante de la suite de reportes es la capacidad de rastrear su embudo de reclutamiento, asegurando que ya no tenga que preguntarse si su estrategia de divulgación está funcionando. Al analizar la salud técnica de sus comunicaciones, puede refinar su secuencia y cronograma para mejores tasas de conversión.
- Desempeño integral del correo electrónico: Monitoree métricas de salud críticas incluyendo Tasas de apertura de correo, Quejas de spam, Tasas de baja y Tasas de rebote para asegurar que su dominio permanezca saludable.
- Seguimiento del volumen del embudo: Vea datos de reclutamiento de alto nivel, como exactamente cuántos influencers fueron contactados versus cuántos respondieron, para calcular su porcentaje de conversión general.
- Análisis de seguimiento estratégico: El sistema rastrea el número promedio de correos electrónicos necesarios para obtener una respuesta (por ejemplo, si el 40% de los influencers responden después del primer correo o el 34% después del segundo), permitiéndole optimizar sus secuencias de automatización.
- Cuentas de correo electrónico con mejor desempeño: Identifique qué cuentas de correo específicas (SMTP, Outlook, Gmail, etc.) generan el mayor compromiso y cuáles pueden estar marcadas o con bajo desempeño.
Paso 4: Análisis del gifting y ROI automatizado
Para muchas marcas DTC, el mayor "costo oculto" es el gifting. Influencer Hero se conecta directamente a su CMS de eCommerce para rastrear los lados físicos y financieros de sus campañas en una vista unificada.
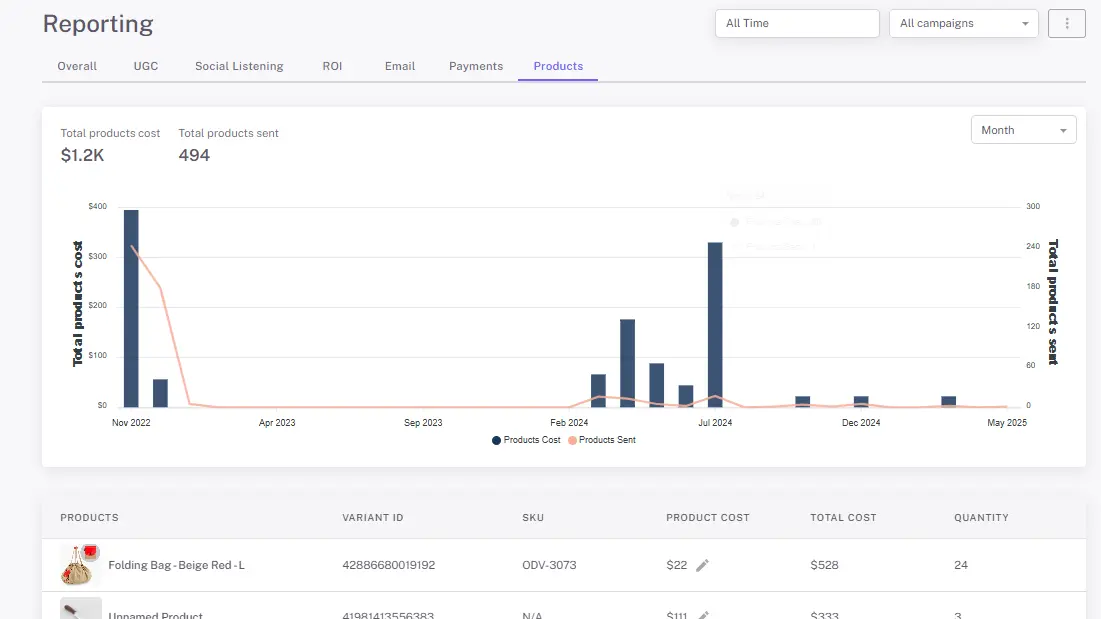
Pestaña de Productos: Gifting automatizado y seguimiento de inventario
Si bien los datos de gifting se encuentran en la pestaña Productos, proporciona la base de costos esencial para su rentabilidad general.
- Seguimiento automatizado de COGS: Para la mayoría de los usuarios, los costos de productos se extraen automáticamente de su tienda, eliminando la necesidad de entrada de datos manual.
- Análisis de volumen de seeding:Ver gráficos claros que detallan "Gasto Total en Envíos de Productos" versus "Total de Productos Enviados" para monitorear la escala de sus esfuerzos de seeding.
- Alineación de Inventario: Realice un seguimiento exacto de cuántos productos se han enviado cada mes para mantener a su equipo de logística alineado y evitar desabastecimientos.
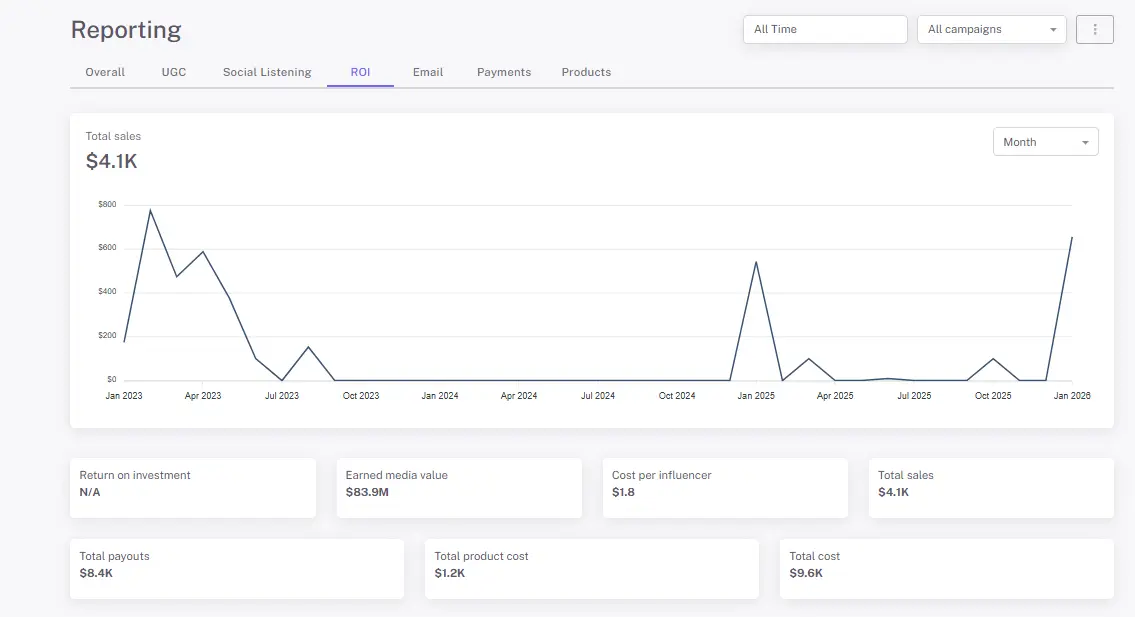
Pestaña ROI y Finanzas: Comprobando la Rentabilidad Neta
Esta pestaña extrae datos de sus productos e información de pagos para ofrecerle una visión definitiva de la salud financiera de su campaña.
- Métricas de Rentabilidad Verdadera: El sistema calcula su costo total combinando los costos de productos con los pagos a influencers, comparándolos con las ventas totales para mostrar su ROI neto.
- Valor de Medios Ganados (EMV): Más allá de las ventas directas, realice un seguimiento de su EMV para comprender el impacto total de medios y el valor de marca generado por sus asociaciones.
- Costo por Engagement: Analice "Costo por Influencer" para identificar qué socios son más eficientes para generar tráfico y ventas.
- Ventas Específicas por Plataforma: Vea qué plataformas sociales generan los ingresos más altos para asignar mejor su presupuesto de marketing futuro.
Paso 5: Optimización de Pagos y Presupuestación
El paso final en el flujo de trabajo de reportes es cerrar el ciclo de finanzas. En lugar de perder tiempo en transferencias bancarias manuales, el sistema proporciona un centro de reportes de pagos centralizado.
- Procesamiento por Lotes: Puede procesar pagos a influencers en lotes directamente a través de la plataforma, eliminando la necesidad de transacciones manuales individuales.
- Auditorías Financieras: Genere reportes semanales o mensuales para ver exactamente qué se ha pagado versus qué se adeuda, haciendo la presupuestación fluida para su equipo de finanzas.
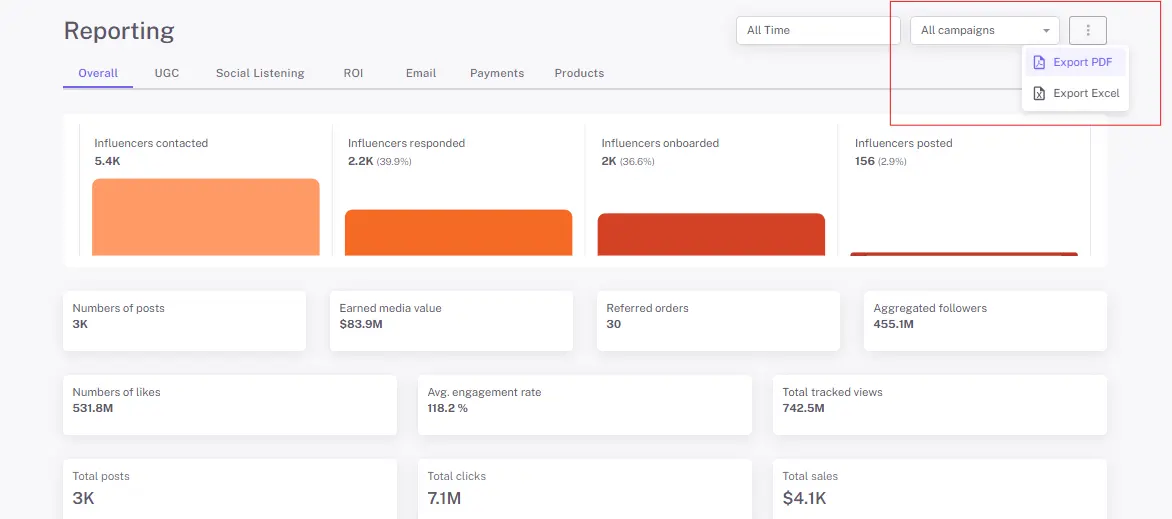
Paso 6: Exportación para Acción
Los datos solo son útiles si se pueden compartir. Además de las exportaciones estándar de Excel, Influencer Hero ha introducido una función de Exportación a PDF muy solicitada.
Ahora puede generar reportes PDF listos para presentación que incluyan todos los gráficos visuales y KPIs mencionados arriba. Ya sea que esté reportando a un cliente o a su CEO interno, estos reportes convierten números crudos en una historia profesional del éxito de la campaña.
Qué Puede Hacer con Reportes y Análisis
Una vez que una campaña está activa, el objetivo cambia de la ejecución a la validación. La suite de Reportes y Análisis es la herramienta de diagnóstico definitiva, probando si su estrategia está alcanzando sus objetivos o necesita un cambio. Aquí es cómo utiliza datos para medir el éxito verdadero de la campaña:
1. Identifique Sus Impulsores de ROI
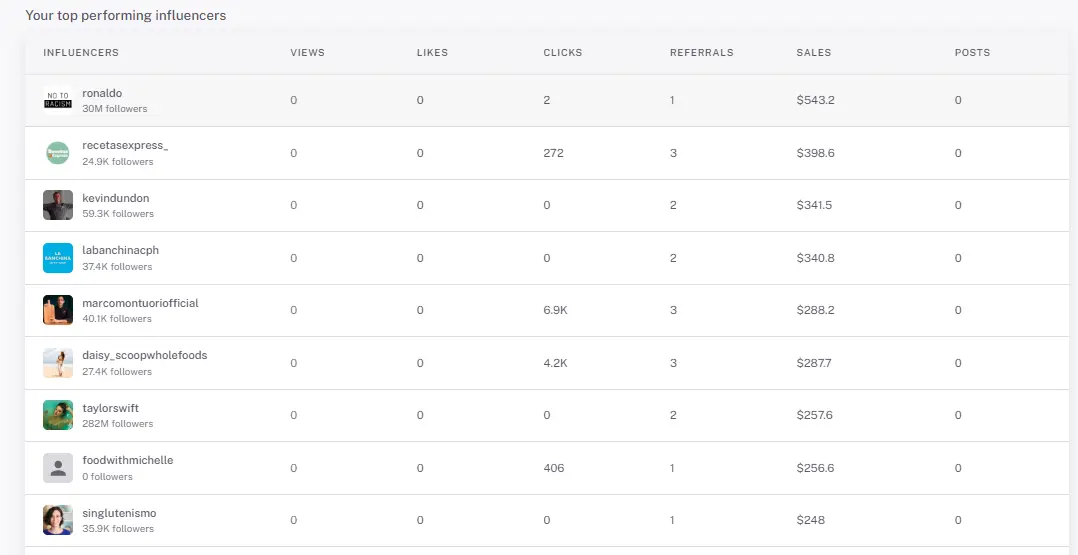
La plataforma va más allá de "métricas de vanidad" al agregar el rendimiento en una tabla de clasificación clara dentro de la pestaña General. Puede ver instantáneamente qué creadores están realmente moviendo la aguja en conversiones y clics dentro de rangos de fechas específicos y campañas específicas. Esto le permite dejar de adivinar y comenzar a duplicar los socios específicos que están generando un retorno positivo.
2. Mida la Rentabilidad del Resultado Final
Una campaña no es exitosa si los costos superan las ganancias. Influencer Hero ahora extrae automáticamente los costos de productosde tu Shopify para rastrear el Costo Total de Bienes Vendidos (COGS) contra los ingresos generados. Esto te proporciona una vista transparente y sin intervención de tus márgenes de ganancia reales, asegurando que tus estrategias de gifting o pagas sean sostenibles y escalables.
3. Valida Tu Estrategia de Niveles
El escalado estratégico requiere saber qué "tamaño" de influencer realmente resuena con tu audiencia. Al analizar nuevos gráficos visuales como "Total de Influencers por Tamaño" y "Total de Me Gusta por Tamaño," puedes ver exactamente dónde es más efectivo tu presupuesto. Estos datos te dicen si debes cambiar tu gasto hacia Nano-influencers para la interacción o Mega-influencers para el alcance en tu próxima campaña.
4. Audita el Gasto y la Salud Financiera
El éxito también significa un embudo eficiente. Además de rastrear el gasto total y las comisiones pendientes, ahora puedes auditar tu salud de alcance monitoreando las tasas de apertura de correos electrónicos y de respuesta.
5. Demuestra Valor a los Interesados
El conjunto de informes es el puente entre las tareas diarias y la estrategia de alto nivel. Todos los paneles—desde ventas de afiliados hasta desempeño de UGC y Escucha Social—ahora pueden exportarse a informes PDF profesionales. Esto asegura que tu equipo, liderazgo o clientes tengan prueba indiscutible "lista para presentación" de cómo tus esfuerzos de influencer están contribuyendo al crecimiento de la empresa.
Cuándo los Equipos Utilizan Informes y Análisis
Informes y Análisis es una de nuestras características más esenciales, permitiendo a los equipos ir más allá del seguimiento manual y obtener una vista de alto nivel de todo tu ecosistema de creadores. Transforma datos fragmentados en un roadmap estratégico claro, ayudando a las marcas a resolver desafíos de crecimiento del mundo real.
Ya sea que estés gestionando un programa de seeding o una gran red de afiliados, este conjunto es tu activo más valioso en estos escenarios clave:
1. Escalando Tu Desempeño de Afiliados y Ventas
Cuando tu objetivo es ingresos directos, necesitas saber exactamente qué creadores están generando un retorno. En lugar de adivinar basándote en Me Gusta, puedes usar la pestaña ROI para rastrear conversiones, clics y ventas de afiliados totales.
- El Escenario: Estás ejecutando una campaña de ventas de un mes y necesitas decidir qué creadores invitar para un ambassadorship de marca a largo plazo.
- El Flujo de Trabajo: Filtra tu panel por un rango de fechas específico para ver exactamente qué pedidos fueron referidos durante ese período. Accede a la tabla de clasificación para identificar influencers con las tasas de conversión más altas, luego recompensa a esos mejores desempeños moviéndolos a un nivel de comisión más permanente y alto.
2. Auditando Programas de Gifting "Gratuito"
El gifting "gratuito" no es realmente gratuito—cuesta a tu negocio inventario de productos y gastos de envío. Para escalar una estrategia solo de gifting, debes asegurar que el Valor de Medios Ganados (EMV) supere tus costos.
- El Escenario: Has enviado tu último producto a 200 micro-influencers y necesitas justificar el gasto a tu equipo de finanzas.
- El Flujo de Trabajo: Como los costos de productos ahora se extraen automáticamente de tu CMS, puedes ver instantáneamente un gráfico mostrando "Gasto Total en Envíos de Productos" contra el número de productos enviados. Compara este costo contra las impresiones generadas y el EMV para asegurar que tu seeding siga siendo rentable.
3. Optimizando el Embudo de Reclutamiento
Conforme tu programa crece, el cuello de botella frecuentemente ocurre durante la fase de alcance. Los equipos usan la nueva pestaña Alcance para asegurar que su "pitch" realmente esté llegando.
- El Escenario: Estás enviando cientos de correos electrónicos pero no estás viendo los contratos firmados que esperabas.
- El Flujo de Trabajo: Audita tus Tasas de Apertura de Correos Electrónicos y porcentajes de respuesta. Al ver si los influencers típicamente responden después del 1er o 3er correo, puedes optimizar tus secuencias de seguimiento automatizadas para aumentar tu tasa de éxito de reclutamiento.
4. Refinando Tu Perfil de "Creador Ideal"
El éxito frecuentemente depende de encontrar el "tamaño" correcto de influencer para tu nicho específico. Analytics te ayuda a identificar si tu audiencia responde mejor a la confianza alta de un nano-influencer o al alto alcance de un mega-creador.
- El Escenario: Quieres saber si tu presupuesto se gasta mejor en cinco macro-influencers o cincuenta nano-influencers.
- El Flujo de Trabajo: Utiliza los nuevos gráficos "Total de Me Gusta por Tamaño" y "Total de Influencers por Tamaño". Al comparar el seguimiento de participación y rendimiento de publicaciones para cada nivel, puede ver qué grupo proporciona la mayor eficiencia y retorno de inversión y refinar su estrategia de reclutamiento en consecuencia.
5. Gestión de Logística de Alto Volumen y Presupuesto
Los equipos utilizan estas funciones de informes para alejarse del caos administrativo y volver hacia la estrategia.
- El Escenario: Está trabajando con cientos de influenciadores en diferentes niveles y necesita manejar docenas de pagos individuales e informes de partes interesadas.
- El Flujo de Trabajo: Utilice la función de procesamiento por lotes de pago de influenciadores para pagar a todos sus creadores a la vez. Cuando termine el mes, utilice la nueva función "Exportar a PDF" para generar un informe profesional listo para presentación en segundos.
Cómo se Conecta Influencer Hero Reporting & Analytics con Otras Funciones de Influencer Hero
En muchas configuraciones, analizar una campaña es una tarea separada y manual que ocurre semanas después de que el contenido se publica. Construimos Influencer Hero para que los informes no sean una tarea posterior a la campaña, sino un pulso en tiempo real que informe todas las otras partes de su flujo de trabajo.
Así es cómo sus datos fluyen naturalmente a través del resto de la plataforma:
Informes + CRM y Alcance
Los datos recopilados en su suite de informes informan directamente cómo administra sus relaciones.
- Priorice a los Mejores Desempeños: Utilice datos de conversión en tiempo real para etiquetar sus influenciadores más rentables en el CRM para tener acceso prioritario a nuevas campañas.
- Optimice su Embudo: NUEVO: Con la pestaña Alcance actualizada, ahora puede ver Tasas de Apertura de Correo Electrónico y porcentajes de respuesta. Si ve que los influenciadores típicamente responden solo después del tercer seguimiento, puede ajustar sus secuencias de alcance automatizadas en el CRM para maximizar el reclutamiento.
Informes + Obsequios y Pagos
Los datos de rendimiento ahora están vinculados aún más estrechamente a su logística financiera.
- Seguimiento Automatizado del ROI: NUEVO: Porque los costos de producto ahora se extraen automáticamente de su tienda Shopify, la suite de informes calcula instantáneamente el ROI de cada producto enviado sin entrada de datos manual.
- Recompensas Automatizadas: Una vez que la suite de informes captura una venta de afiliado, el sistema calcula y procesa comisiones, convirtiendo puntos de datos en pagos sin inconvenientes.
Informes + Descubrimiento e IA
Los conocimientos que obtiene de las campañas actuales actúan como el "combustible" para sus búsquedas futuras.
- Descubrimiento Impulsado por Datos: Si su análisis revela que un nicho específico de micro-influenciadores está generando el 80% de sus ventas, utilice el filtro Lookalike de la herramienta Discovery para encontrar cientos de perfiles similares.
- Calibración de Estrategia de Nivel: NUEVO: Utilice los nuevos gráficos "Total de Me Gusta por Tamaño" para identificar qué niveles de influenciadores (Nano vs. Mega) son más efectivos, luego filtre su próxima búsqueda Discovery para dirigirse a ese tamaño específico de creador.
Informes + Recopilación de UGC y Escucha Social
Los informes se tratan tanto de números como de valor de contenido.
- Reutilización de Contenido Principal: NUEVO: El panel actualizado ahora presenta una pestaña UGC dedicada que destaca las "3 Publicaciones con Mejor Desempeño" de un vistazo. Puede identificar y descargar este contenido de alto rendimiento directamente para reutilizarlo en anuncios pagados.
- Escucha Social: NUEVO: Rastreé menciones de celebridades e influenciadores fuera de su CRM. Esto le permite identificar fanáticos orgánicos de la marca e incorporarlos a su flujo de trabajo de alcance oficial.
Al mantener sus datos y herramientas bajo un mismo techo, no solo está rastreando una campaña—está construyendo un motor "todo en uno" que ahorra a su equipo horas de trabajo manual y asegura que cada decisión esté respaldada por resultados del mundo real.
Reflexiones Finales
La mejor manera de entender cómo la nueva suite Influencer Reporting & Analytics puede cambiar su flujo de trabajo es ver sus propios datos cobrar vida. Ya sea que esté rastreando el ROI específico de un nivel de micro-influenciadores a través de nuestros nuevos gráficos visuales o utilizando informes de obsequios automatizados para auditar su COGS, la plataforma está diseñada para convertir números brutos en una estrategia clara para el crecimiento.
Al integrar tu informe directamente con tu CRM, alcance y flujos de pago, eliminas hojas de cálculo manuales y te enfocas completamente en escalar asociaciones de alto rendimiento. Con la capacidad de exportar PDF listos para presentación y rastrear la salud del alcance en tiempo real, Influencer Hero proporciona la visibilidad que necesita para pasar de "adivinar" a "saber" exactamente qué impulsa el éxito de su marca.
Reserve una demostración con nuestro equipo para experimentar la simplicidad de nuestra plataforma todo en uno y obtener una vista en vivo de cómo podemos ayudarle a medir y escalar sus resultados de influencers!
Resumen
Este es un texto dentro de un bloque div.
Este es un texto dentro de un bloque div.
Precios/mes
Reseñas de Shopify
Este es un texto dentro de un bloque div.
Este es un texto dentro de un bloque div.
Este es un texto dentro de un bloque div.
Este es un texto dentro de un bloque div.
Este es un texto dentro de un bloque div.
Este es un texto dentro de un bloque div.
Este es un texto dentro de un bloque div.
Este es un texto dentro de un bloque div.
Este es un texto dentro de un bloque div.
Este es un texto dentro de un bloque div.
Este es un texto dentro de un bloque div.
Este es un texto dentro de un bloque div.
Este es un texto dentro de un bloque div.
Este es un texto dentro de un bloque div.
Este es un texto dentro de un bloque div.
Este es un texto dentro de un bloque div.
Este es un texto dentro de un bloque div.
Este es un texto dentro de un bloque div.
Este es un texto dentro de un bloque div.
Este es un texto dentro de un bloque div.
Este es un texto dentro de un bloque div.
Leer más
Preguntas frecuentes
¿Qué métricas puedo seguir en el panel de informes?

La plataforma le proporciona una vista completa de sus KPI de campaña más importantes, incluidas las impresiones totales, clics y conversiones. También puede monitorear resultados específicos del extremo inferior del embudo, como ventas de afiliados por creador y el Valor de Medios Ganados (EMV) general.
¿Puedo rastrear los costos asociados con el envío de productos?
Sí. Influencer Hero le permite analizar su Costo de Bienes Vendidos (COGS) para campañas de gifting sincronizando directamente con su CMS de comercio electrónico. Esto le ayuda a rastrear exactamente cuántos productos se enviaron y el gasto total involucrado en sus esfuerzos de seeding.
¿Es posible ver cuáles son los influencers individuales que están teniendo el mejor desempeño?
Por supuesto. El sistema incluye una tabla de clasificación simple que identifica sus socios con mejor desempeño según sus resultados en tiempo real. Esto le permite evaluar el rendimiento en diferentes tamaños de influencers—desde nano hasta mega—y recompensar a quienes generan el mayor ROI.
¿Cómo maneja la plataforma los pagos a los influencers?
Puede realizar un seguimiento de los pagos a influencers generando informes semanales y mensuales para mantener su presupuesto sin complicaciones. Para ahorrar tiempo, la plataforma también cuenta con una herramienta de procesamiento por lotes que le permite gestionar múltiples pagos a creadores de una sola vez en lugar de procesarlos manualmente.
¿Puedo compartir estos informes con mi equipo o clientes?
Sí. Todos los gráficos y funciones de informes están diseñados para una fácil comprensión. Puede generar informes exportables y paneles de ROI para compartir la visibilidad del rendimiento en tiempo real y los detalles de la campaña con partes interesadas o equipos internos.
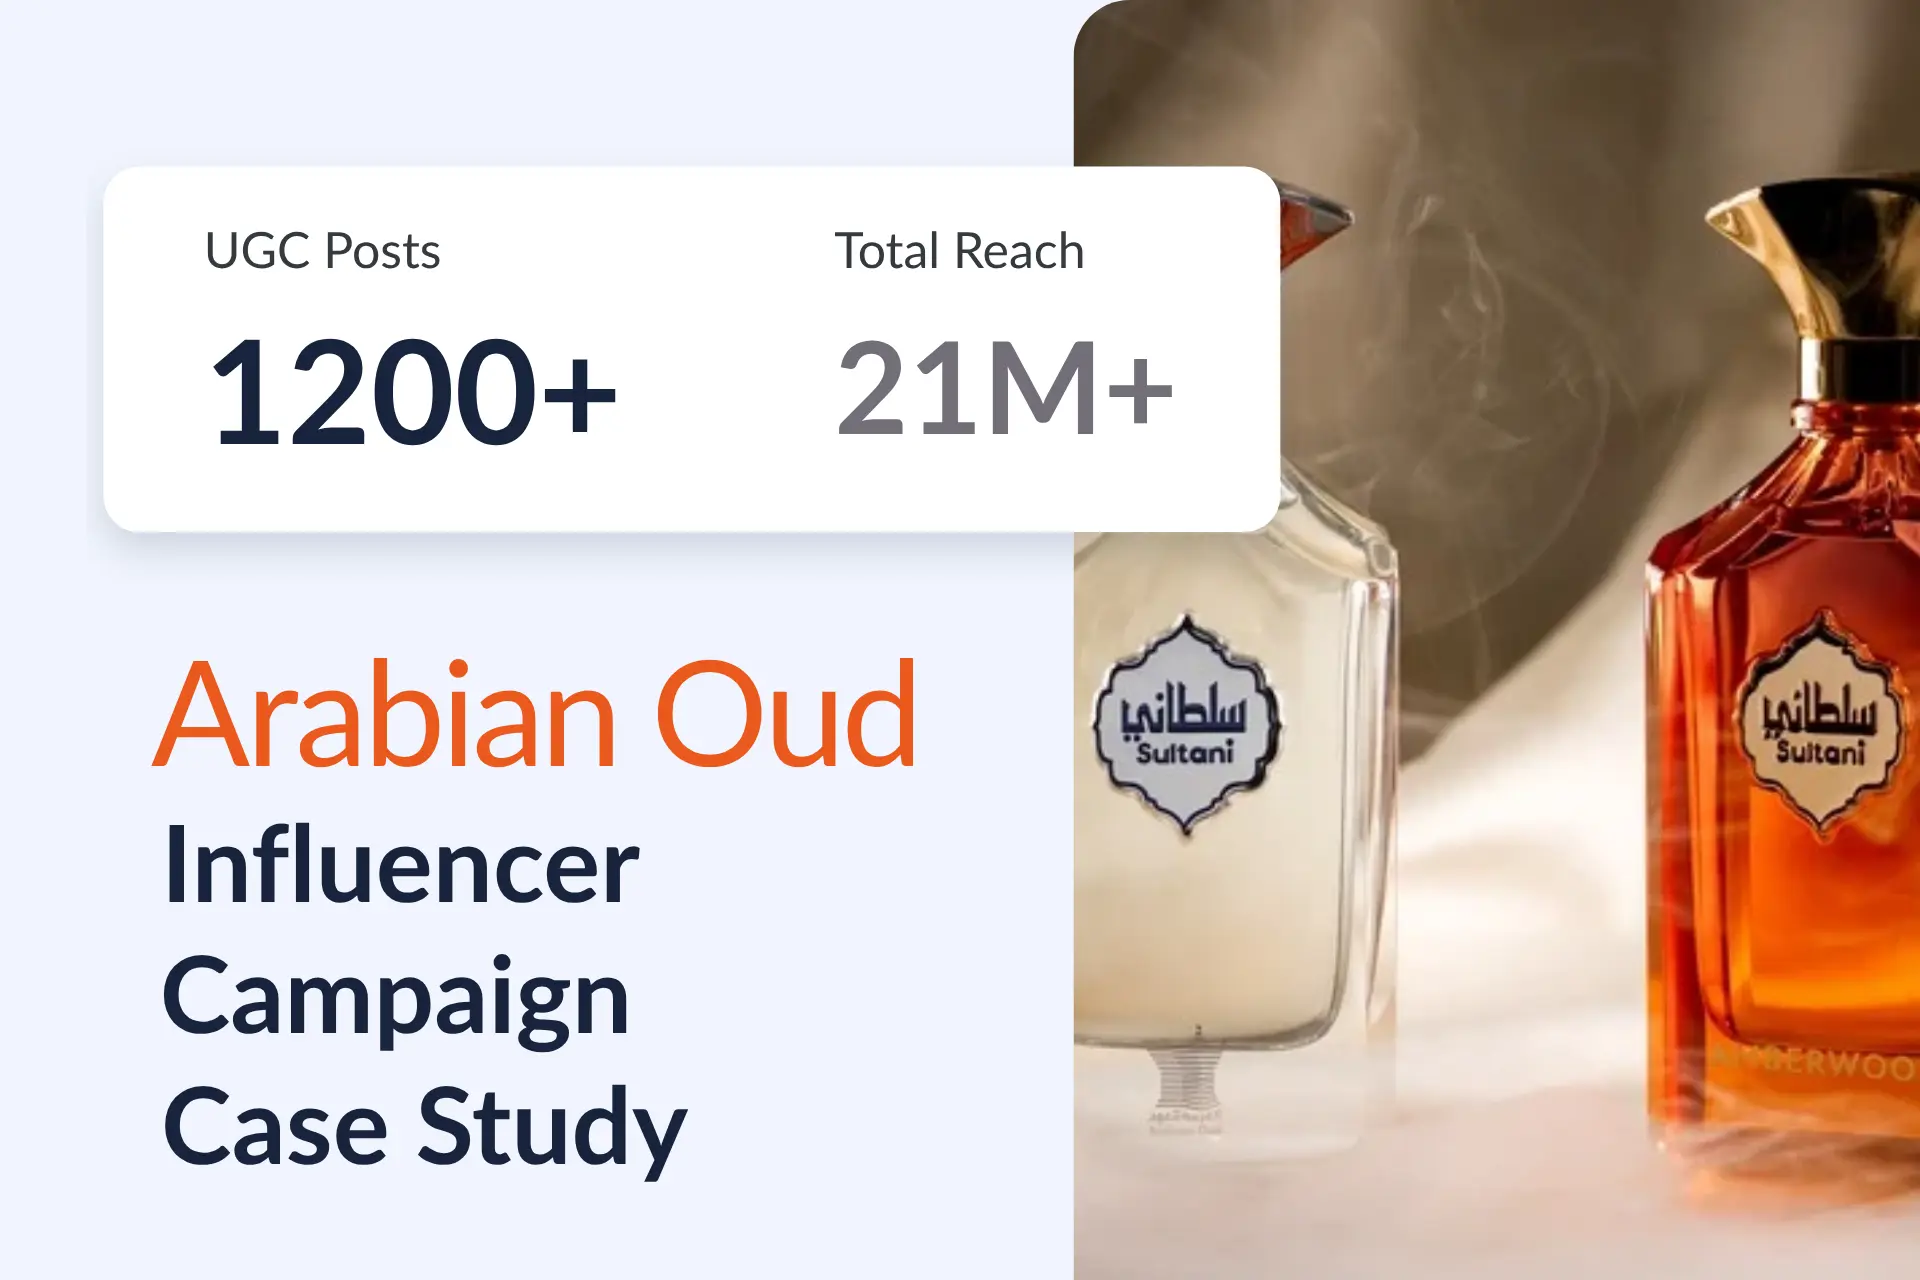

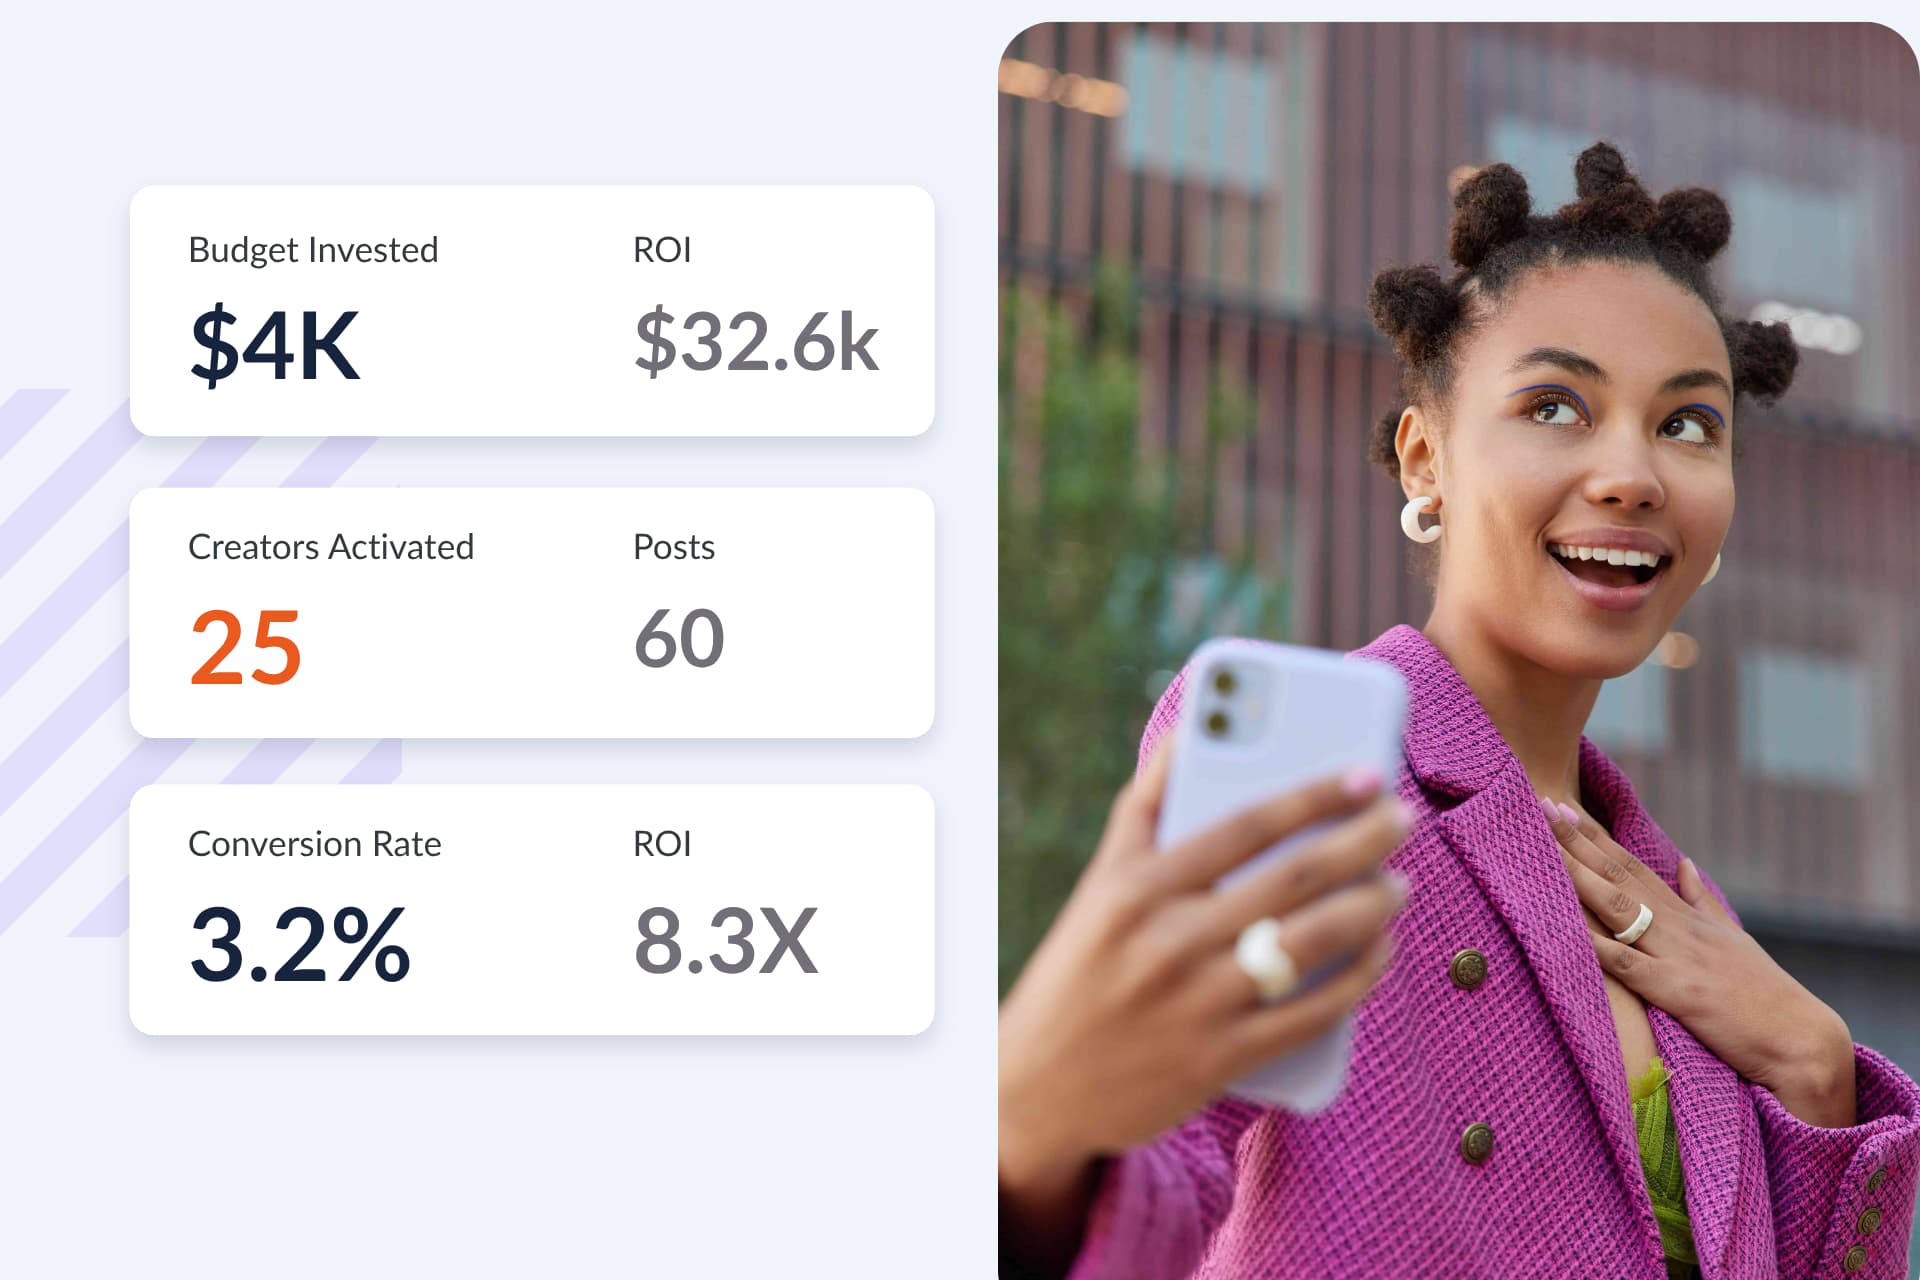
Blogs más populares


¿Estás listo para lograr un ROI de más de 10 veces?
Programa una demostración con uno de nuestros expertos en medios a continuación.