
Influencer Reporting & Analytics: Measure Performance and Campaign Results

March 27, 2026
|
Published

August 16, 2026
|
Updated

15 minutes
|
Reading

Influencer Performance Marketing Course | VOUCHER: IMC100

María Vincenzini
| Author

Table of Contents
- Influencer Reporting & Analytics
- How it Works in Influencer Hero
- Navigating the Performance Dashboard
- Analyzing Your Entire Roster
- Ranking and Tracking Mentions
- Auditing Your Outreach and Recruitment Funnel
- Analyzing Gifting and Automated ROI
- Payments, Invoicing and Budgeting
- Exporting for Action
- What You Can Do With Reporting & Analytics
- When Teams Use Reporting & Analytics
- How it Connects With Othe Features
- Final Thoughts
- FAQs
Drive ROI With Influencers

Global Influencer Database
ALL-IN-ONE platform
CRM, Affiliate, UGC & More
Influencer Reporting & Analytics: Measure Performance and Campaign Results
Whether you are moving off manual spreadsheets or refining a program you already run, your data is what decides whether you measure campaign ROI accurately or keep guessing. This article walks through exactly how the Reporting & Analytics suite works inside Influencer Hero and how to turn campaign data into decisions you can act on.
The suite is a real-time command center that gives you full visibility over your campaigns through specialized data tabs. It connects directly to your e-commerce CMS, which closes the gap between social engagement and business results: reach, clicks, affiliate sales, outreach performance and product costs all live in one place.
Since the last major update, the suite also plugs into a rebuilt Payout Manager, invoicing workflows, custom fields, and a new All Influencers tab that lets you analyze your entire creator roster in a single view instead of campaign by campaign.
Let's get into how it works in practice.
How Reporting & Analytics Works in Influencer Hero
Think of the Reporting & Analytics suite as the ROI engine of your influencer program. Other tools focus on the "who" and the "how." This one answers the question that actually matters: is this campaign working?
It moves past surface-level likes to prove the business value of every partnership, whether you run large affiliate programs or awareness-led seeding campaigns. It behaves like an automated audit of your entire operation, pulling data straight from social platforms and your e-commerce store so you never manually calculate a conversion again.
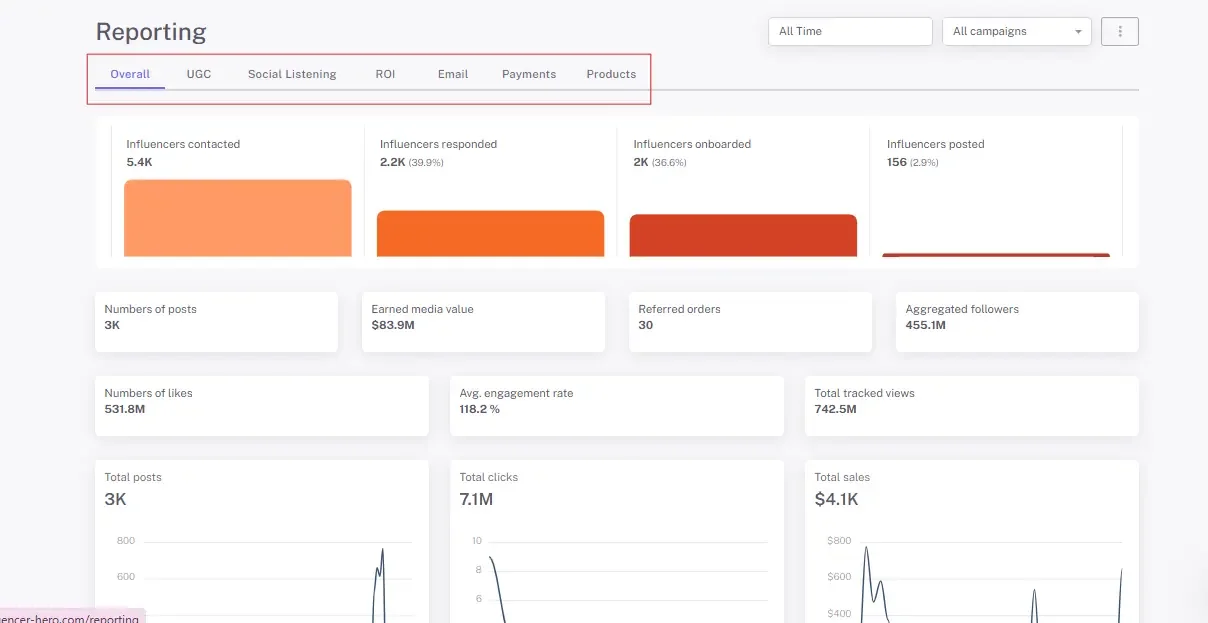
The redesigned interface splits that data into specialized tabs (Overall, UGC, Social Listening, Outreach, ROI & Sales, Payments and Products) so you can look at any stage of the funnel on its own.
Step 1: Navigating the Performance Dashboard
When you open the Reporting section you land on a dashboard built to act as your campaign command center: a high-level summary up top, then dedicated tabs underneath.
The "Overall" Tab: Your Quick Performance Summary
The Overall tab gives you a general read on campaign health. It aggregates data from across the platform, including UGC, social listening, ROI and email reports, for a snapshot of your total reach and impact.
- Dynamic time-range reporting: Filter by specific dates so referred orders and sales only reflect what happened inside that window.
- Funnel visualization: See the full journey from total influencers contacted to referred orders.
- Engagement charts: Use "Total Influencers by Size" and "Total Likes by Size" to spot which follower brackets (nano vs. mega) drive your best results.
- Report scope control: Reports default to campaign board data, which includes influencers imported directly into the board. If you only want outreach data, switch the scope from the three-dot menu in the top right corner of the report.
One nuance worth knowing when you read these numbers: an influencer counts as onboarded once they have received a product or posted a tracked UGC piece. That definition keeps your onboarding rate tied to real activity rather than a status someone forgot to update.
The Specialized Tabs
Each tab isolates one part of the funnel:
- UGC: Tracks every post gathered and surfaces your top performing content by views, likes and comments.
- Social Listening: Tracks tagged-in content, showing who talks about your brand organically outside your formal campaign contacts.
- ROI & Sales: Where you track financial impact, including Earned Media Value (EMV) and total sales by platform, pulled from your connected store in real time.
- Payments: Your financial ledger for creator compensation. Payout statuses, pending invoices and commission tracking all live here.
- Products: The logistics hub for gifting. It tracks inventory sent to influencers, monitors fulfillment through your e-commerce integration, and identifies which products generate the most social engagement.
Step 2: Analyzing Your Entire Roster With the All Influencers Tab
Campaign-level reporting tells you how a campaign performed. It does not tell you how a creator is performing across everything you have ever run with them. That is the gap the All Influencers tab closes.
Found under Campaign Manager > All Influencers, it gives you a single view of every influencer in your CRM across all campaigns, with the filtering and column control you would expect from a proper analysis tool.
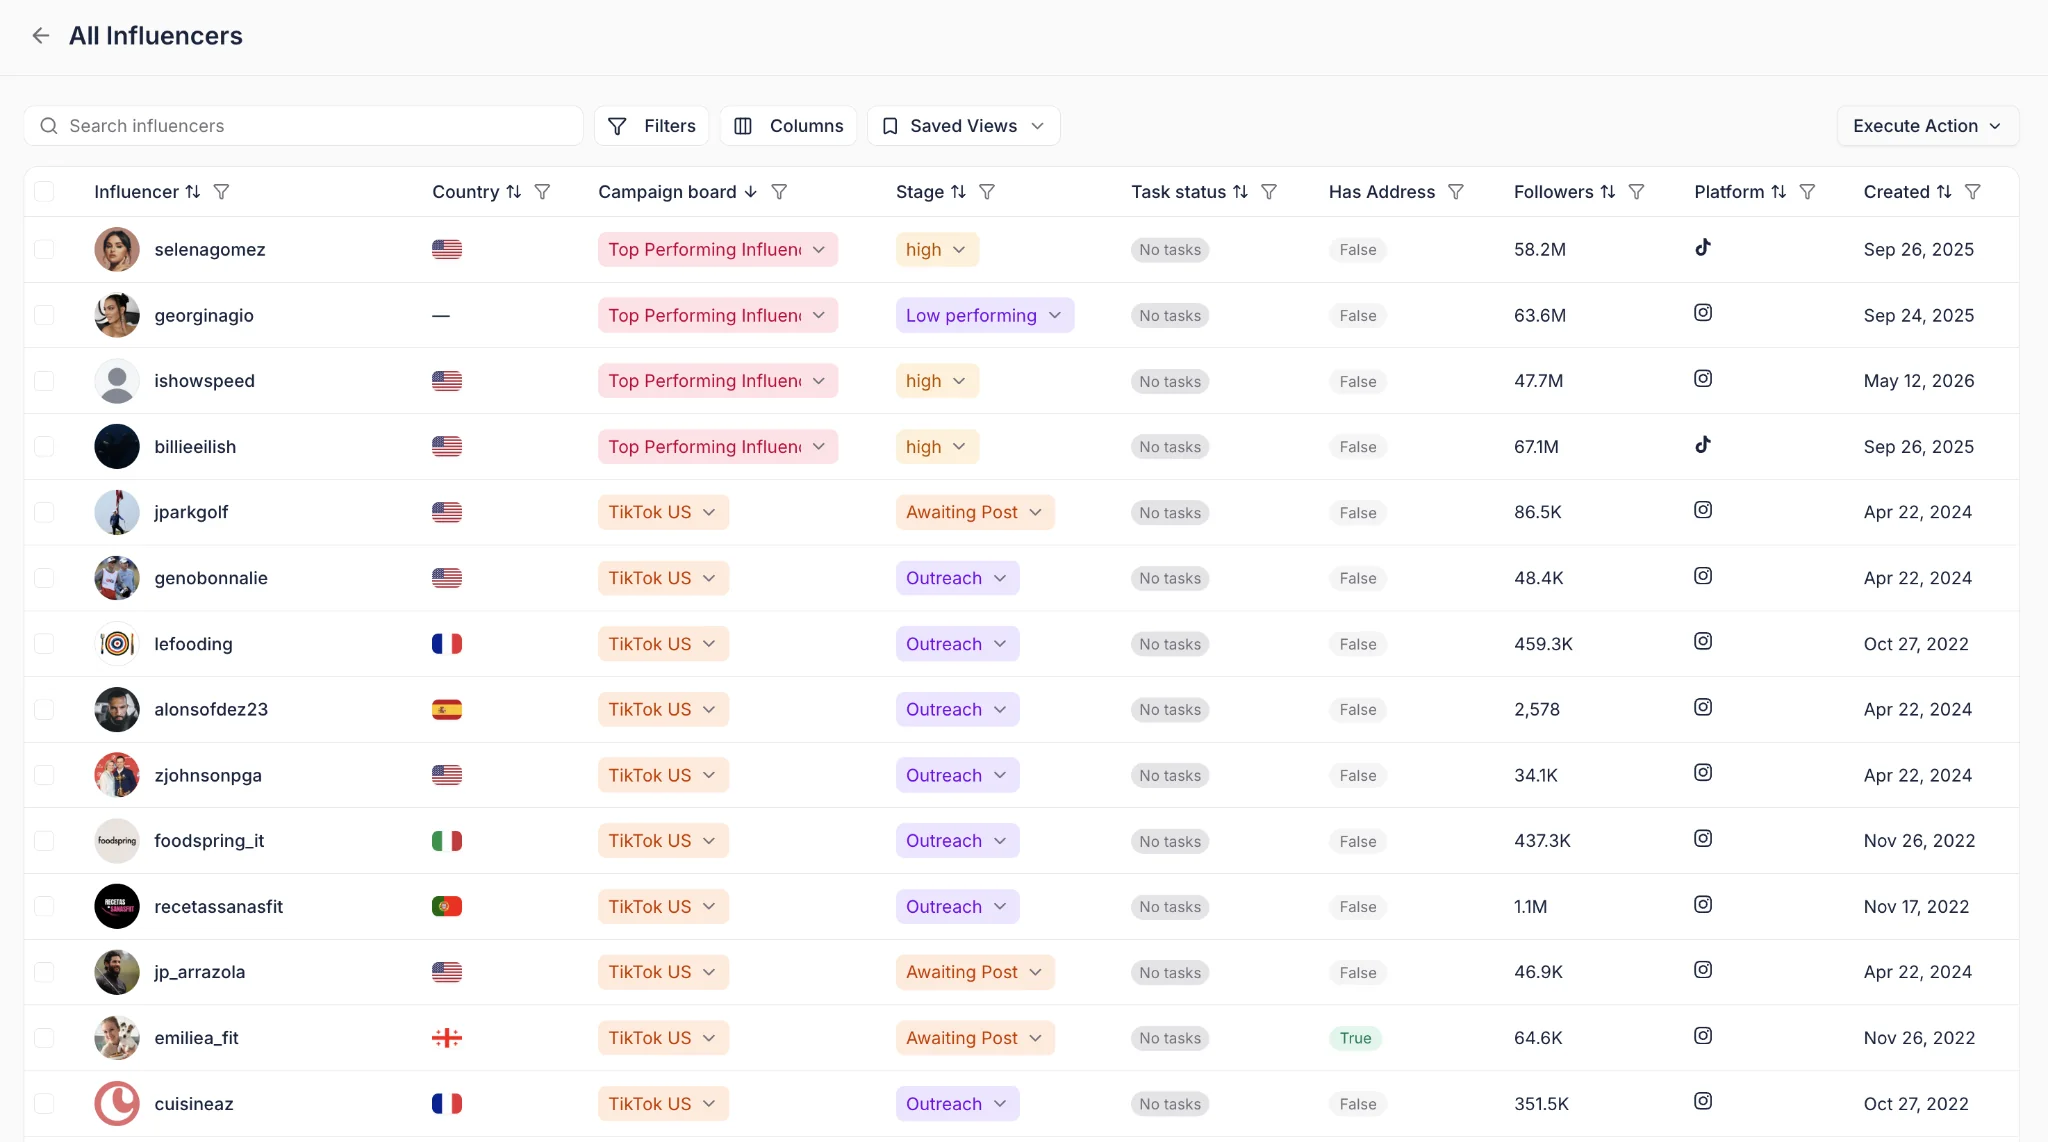
- Advanced and AI-powered filtering: Filter by more than 20 built-in criteria, or describe what you want in plain language. Something like "influencers in the US who posted more than 5 times but made less than $2k in sales" returns exactly that segment.
- Custom columns: Build the view around the metrics you actually report on, then save it.
- Saved views: Keep a view private, or make it team-visible so everyone reports off the same definition.
- Bulk actions from the list: Once a segment is on screen, act on it. Send an email, trigger a flow, create a task, or fire an integration action across the whole group.
That last point is what makes this a reporting feature rather than a directory. You are not just identifying underperformers or your top 5% of earners, you are actioning them in the same screen.
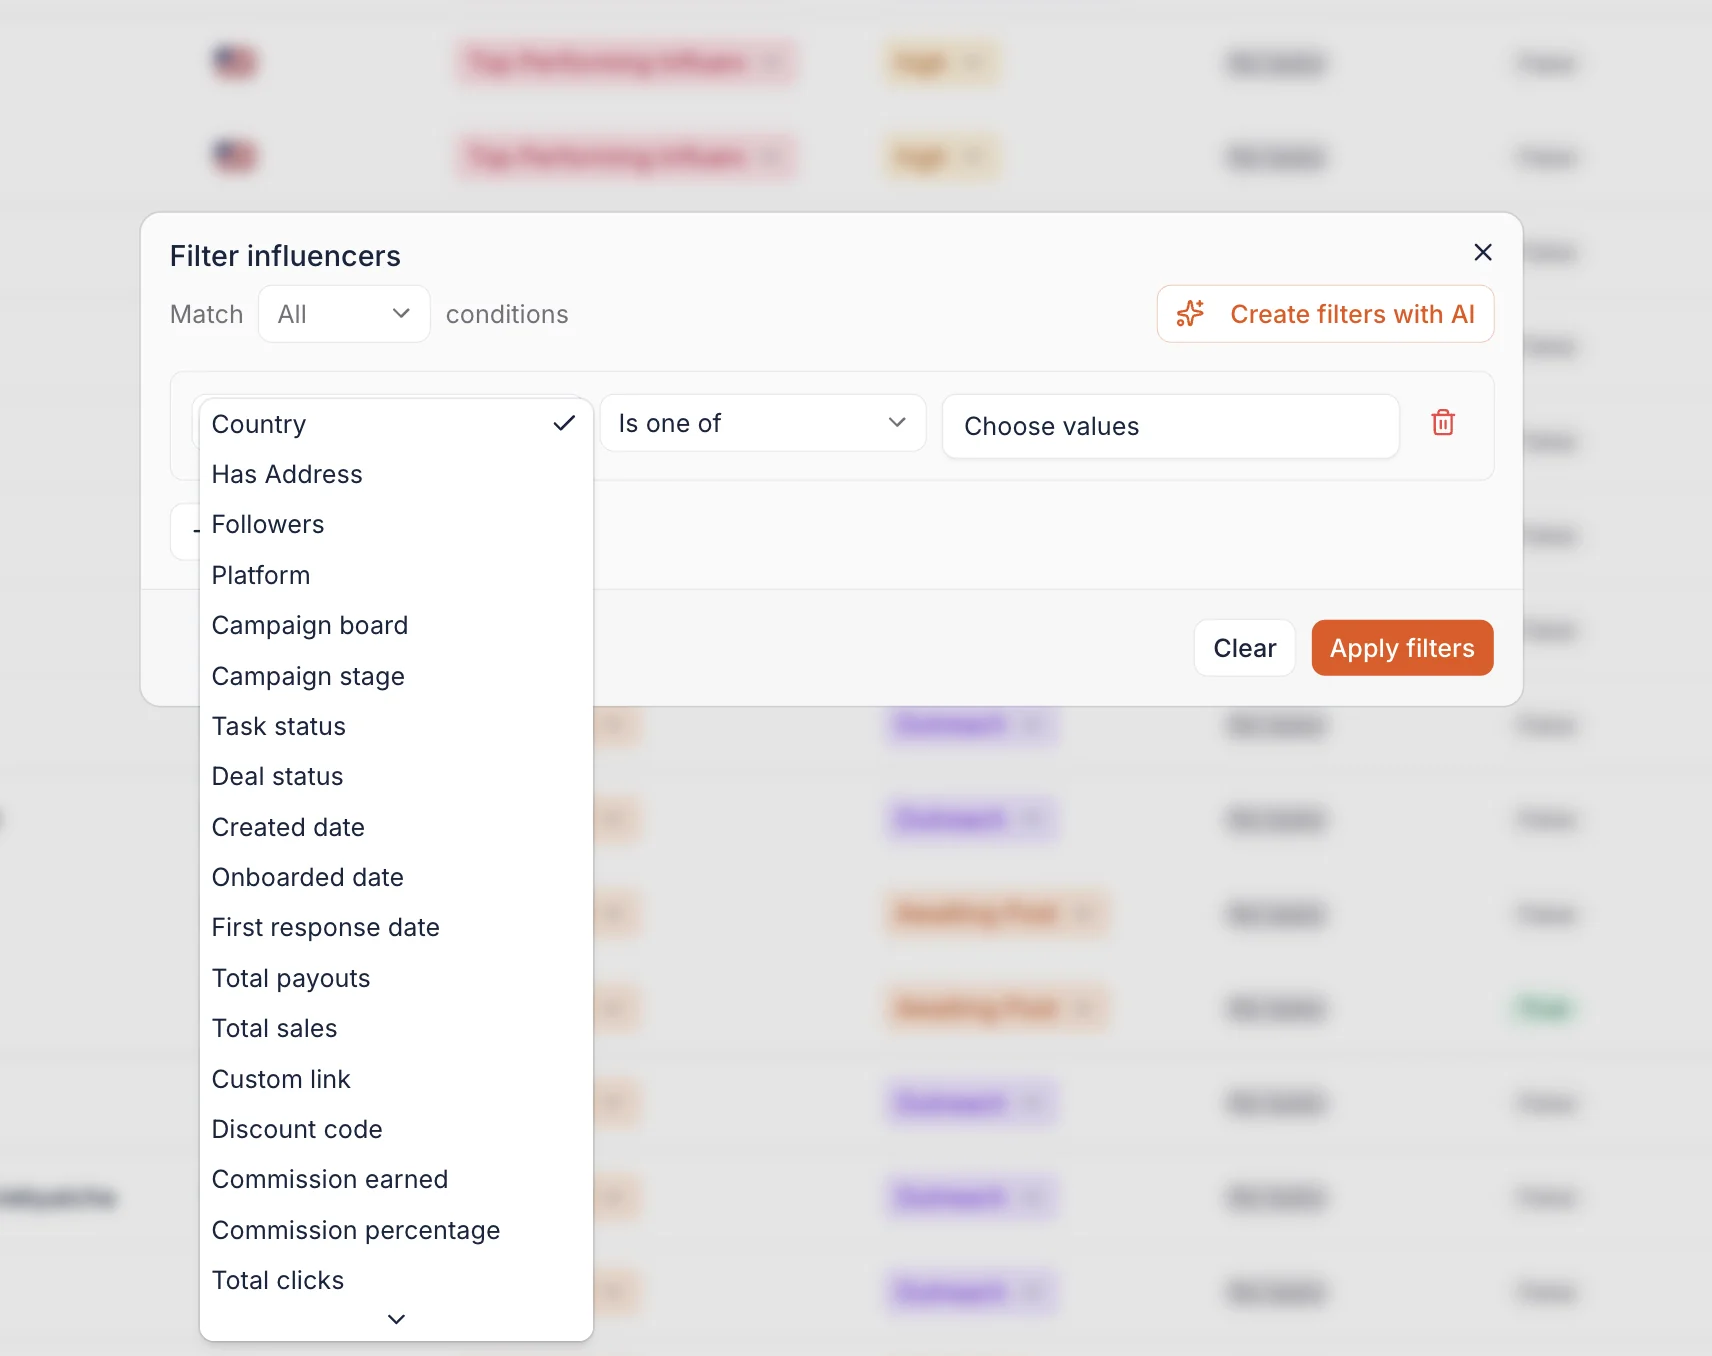
Two things to keep in mind: AI-powered filters draw from your monthly GPT credits, and custom field columns only populate for influencers who have that field filled in on their deal page. You can follow every release in our product updates log.
Reporting on Data That Is Specific to You
Standard metrics cover most of what you need. The rest is where custom fields come in.
You can now add your own Text, Number or Date fields to deal pages, up to 10 per account, and pull them straight into your All Influencers columns. Tiered commission rates, per-influencer gifting caps, contract renewal dates, agency ownership: whatever your setup tracks that a default field does not.
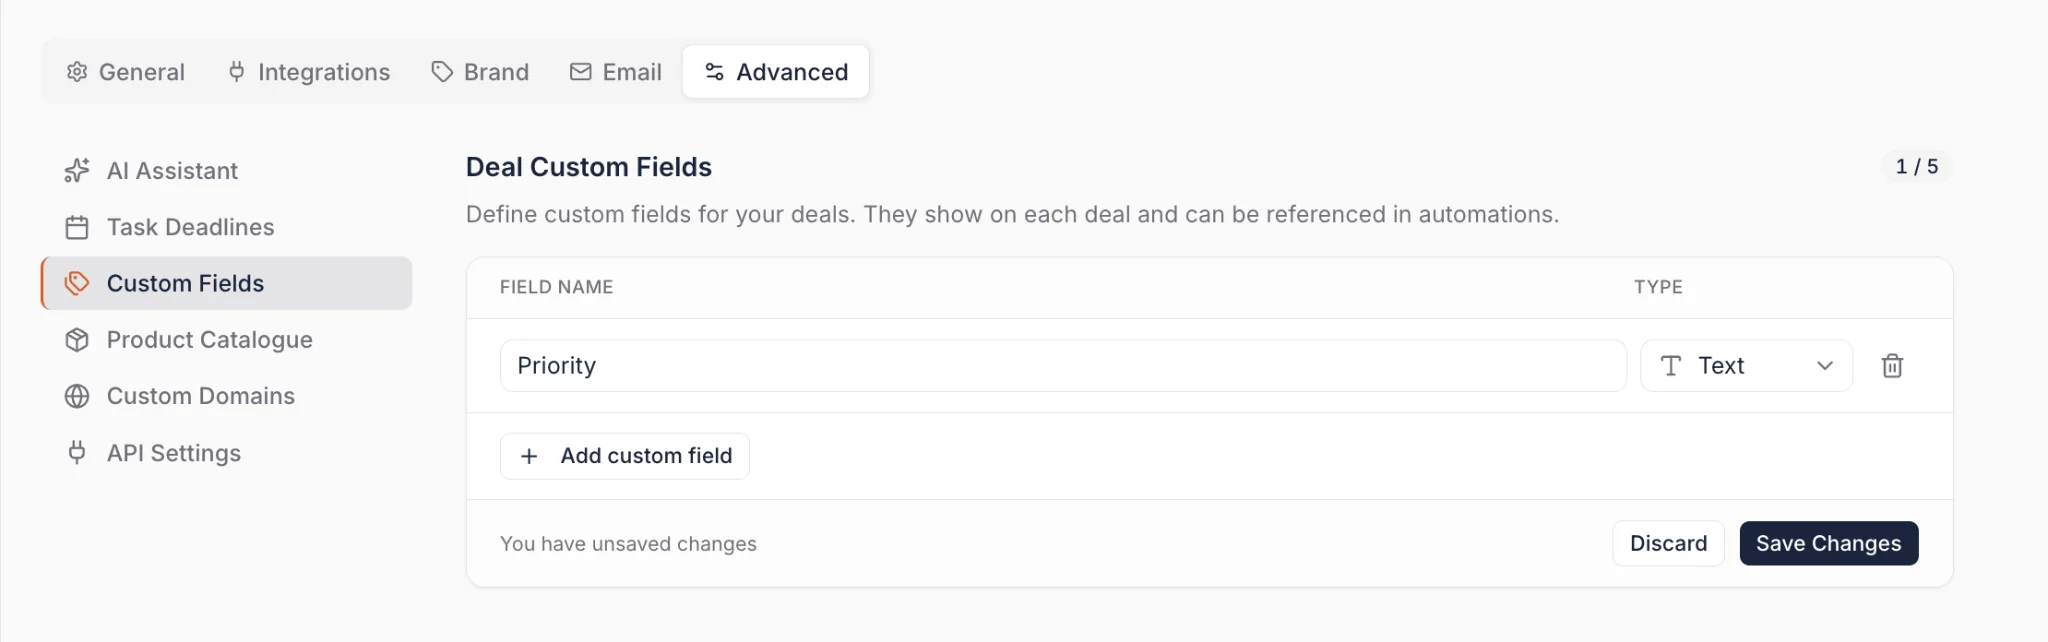
Those same fields are readable by Campaign Board automations, so a single automation can apply different thresholds per influencer instead of one flat rule across your whole roster. Custom fields are created under Settings > Advanced Settings > Custom Fields.
Step 3: Ranking Top Content and Tracking Organic Mentions
This step moves you from general campaign health to individual accountability.
Finding Your Top Performing Content
The UGC tab automatically identifies your top performing content based on engagement, surfacing the three best posts at a glance. That makes it easy to share wins with clients or stakeholders without building a deck from scratch.
For deeper analysis of your user-generated content, the refreshed Content Wall is where the volume lives. Likes are visible directly on the wall and sortable by performance, and an AI recommended sort ranks posts by visual quality so the better-looking content appears first by default. You can also search by keyword or filter by media type, visual quality score, product visibility and aspect ratio, which matters once you are working through thousands of posts instead of dozens.
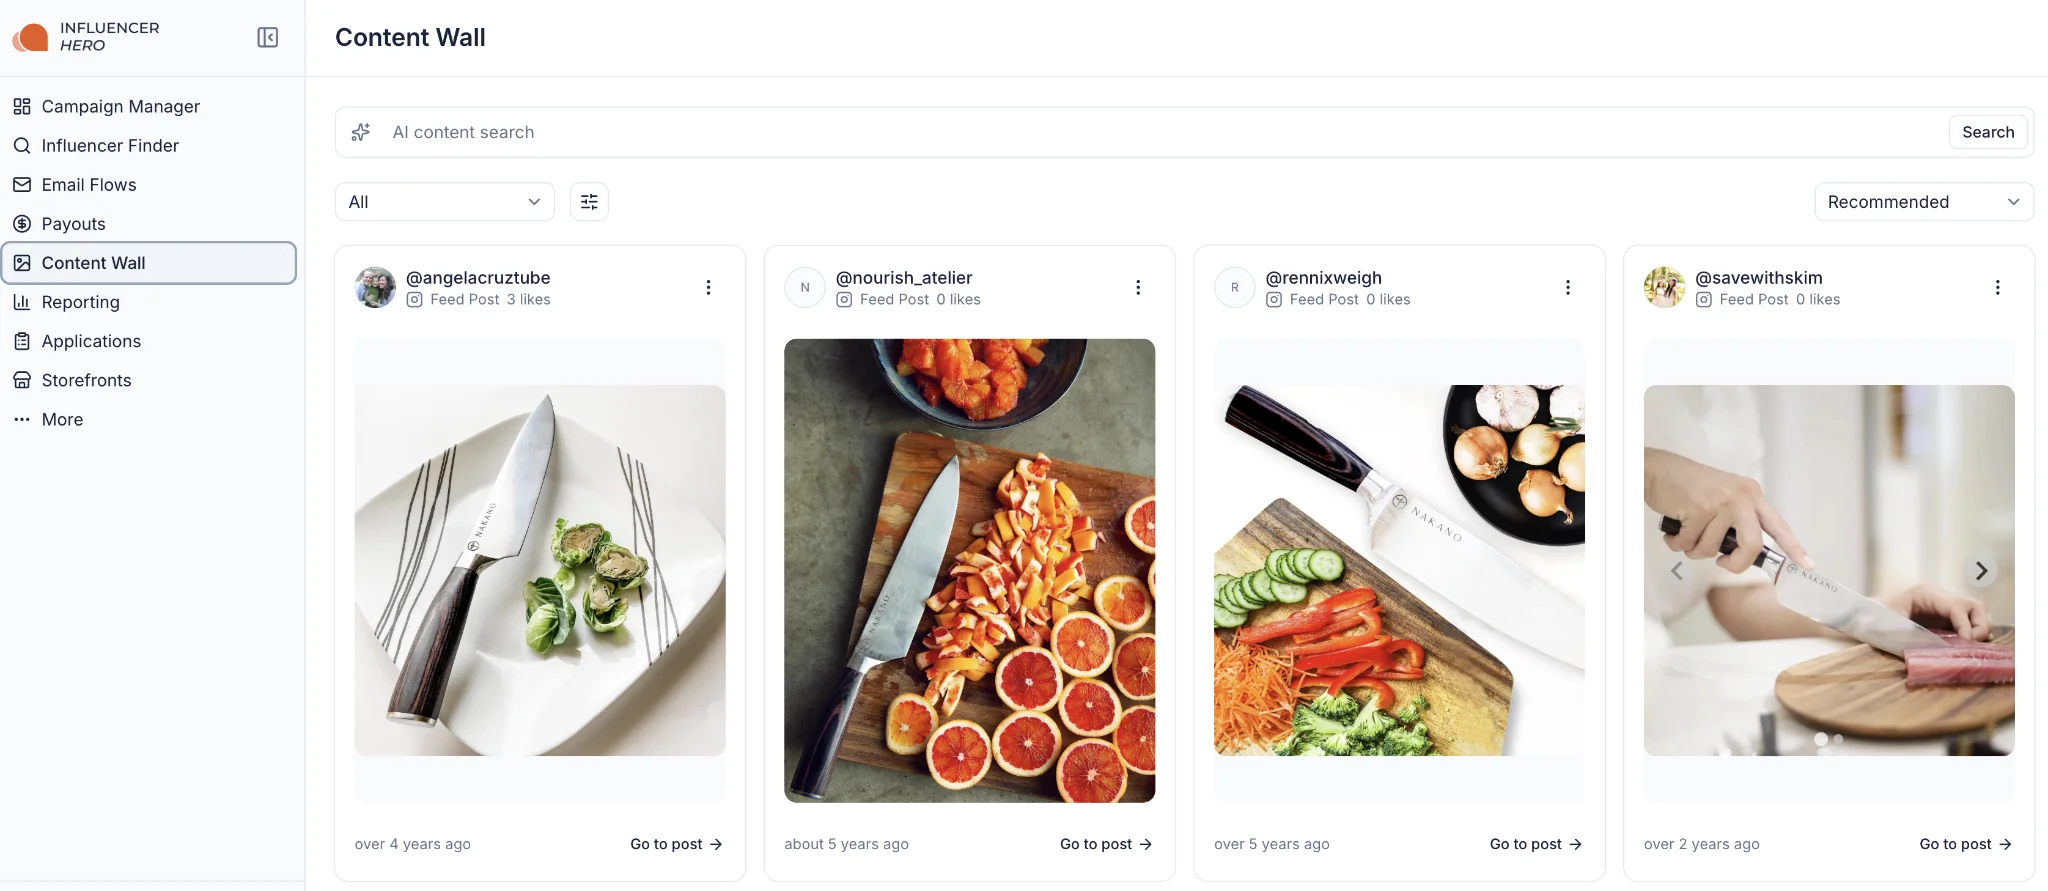
Worth noting: feed and story posts may not include view metrics, and the depth of AI video analysis depends on your plan.
Reviewing Content Before It Goes Live
Reporting on content that already published is useful. Catching problems before it publishes is better. You can now request, review and approve influencer content directly from the deal page.
Trigger a content request and the influencer gets notified to submit. Review the submission and either approve it or request an edit with a specific reason, such as the wrong product being shown or a caption that needs changing, which loops the creator back in until it is right. A centralized review overview shows every pending submission across all campaigns, so nothing slips at scale.
Influencers can submit as a direct upload or a Google Drive link, and content review events (submitted, approved, declined) are available as automation triggers.
Social Listening
The Social Listening tab tracks tagged-in content where your brand was mentioned by influencers who are not in your CRM. It captures the organic halo effect of your program and shows who else is talking about you, including creators you never contacted.
Step 4: Auditing Your Outreach and Recruitment Funnel
You no longer have to guess whether your influencer outreach strategy is working. By analyzing the technical health of your communications, you can fix sequence and timing before they cost you signups.
- Comprehensive email performance: Monitor open rates, spam complaints, unsubscribe rates and bounce rates to keep your domain healthy.
- Funnel volume tracking: See how many influencers were contacted versus how many responded, and calculate your conversion percentage.
- Strategic follow-up analytics: The system tracks the average number of emails needed to get a response, for example whether 40% of influencers reply after the first email or 34% after the second, so you can optimize your automation sequences around real data.
- Top performing email accounts: Identify which accounts (SMTP, Outlook, Gmail and others) generate the highest engagement and which may be flagged or underperforming.
The follow-up data is more useful now that you can act on it in the same workflow. The AI Response Drafter writes replies for you to review and send, and AI Follow-up Suggestions generate personalized follow-ups that reference the actual conversation and offer terms rather than a generic bump. You can set tone, pacing and hard limits at campaign or account level, so what your reporting tells you about follow-up timing translates straight into how the sequences behave.
Step 5: Analyzing Gifting and Automated ROI
For most DTC brands the biggest hidden cost is gifting, and our full gifting guide covers how to structure those campaigns before you report on them. Influencer Hero connects to your e-commerce CMS to track both the physical and financial sides of your campaigns in one view.
Important update here: this is no longer Shopify-only. Affiliate sales tracking, discount code creation and cost data now work across WooCommerce, Magento, Magento 2.X, BigCommerce, Amazon, Wix, Squarespace, Webflow, Square, Prestashop, ShopBase, Ecwid and Thinkific, alongside Shopify and GoAffPro. If your store runs anywhere other than Shopify, your reporting is no longer a manual export.
Products Tab: Automated Gifting and Inventory Tracking
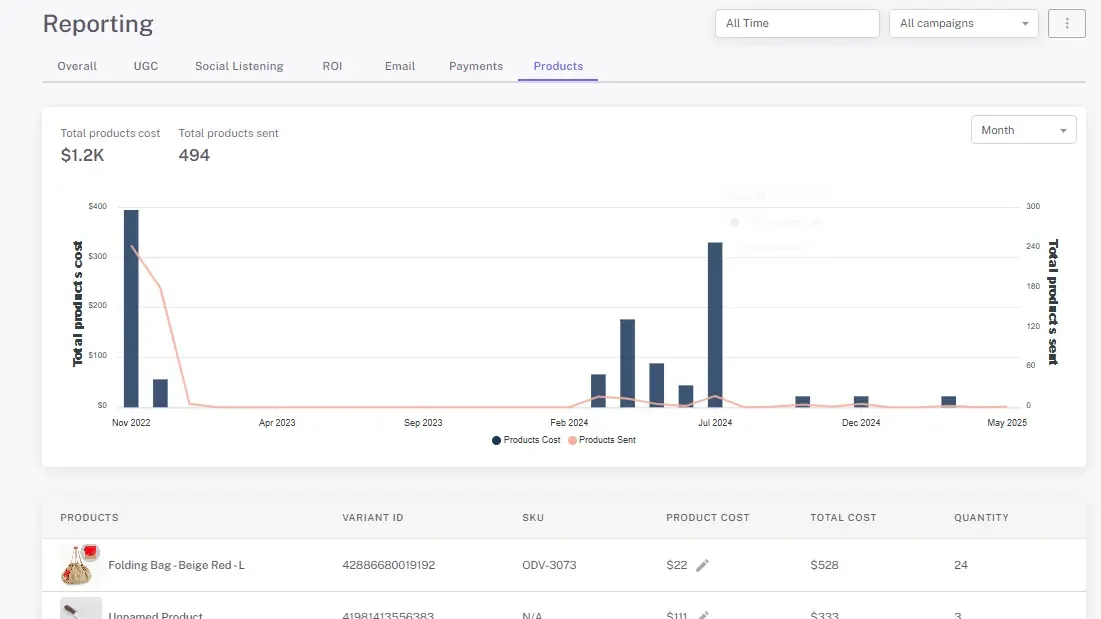
Gifting data lives in the Products tab, and it provides the cost basis for your overall profitability.
- Automated COGS tracking: Product costs pull automatically from your connected store, which removes the manual data entry.
- Seeding volume analytics: View charts covering "Total Spend on Product Sendings" against "Total Products Sent" to monitor the scale of your gifting.
- Inventory alignment: Track how many products shipped each month to keep logistics aligned and avoid stockouts.
ROI & Financials Tab: Proving Net Profitability
This tab pulls from your product and payout data for a definitive look at campaign financial health.
- True profitability metrics: Total cost combines product costs with influencer payouts, then compares against total sales to show net ROI.
- Earned Media Value: Beyond direct sales, EMV shows the total media impact and brand equity your partnerships generate.
- Cost per engagement: "Cost Per Influencer" identifies which partners are most efficient at driving traffic and sales.
- Platform-specific sales: See which social platforms drive the highest revenue so you can allocate budget accordingly.
Step 6: Closing the Loop on Payments, Invoicing and Budgeting
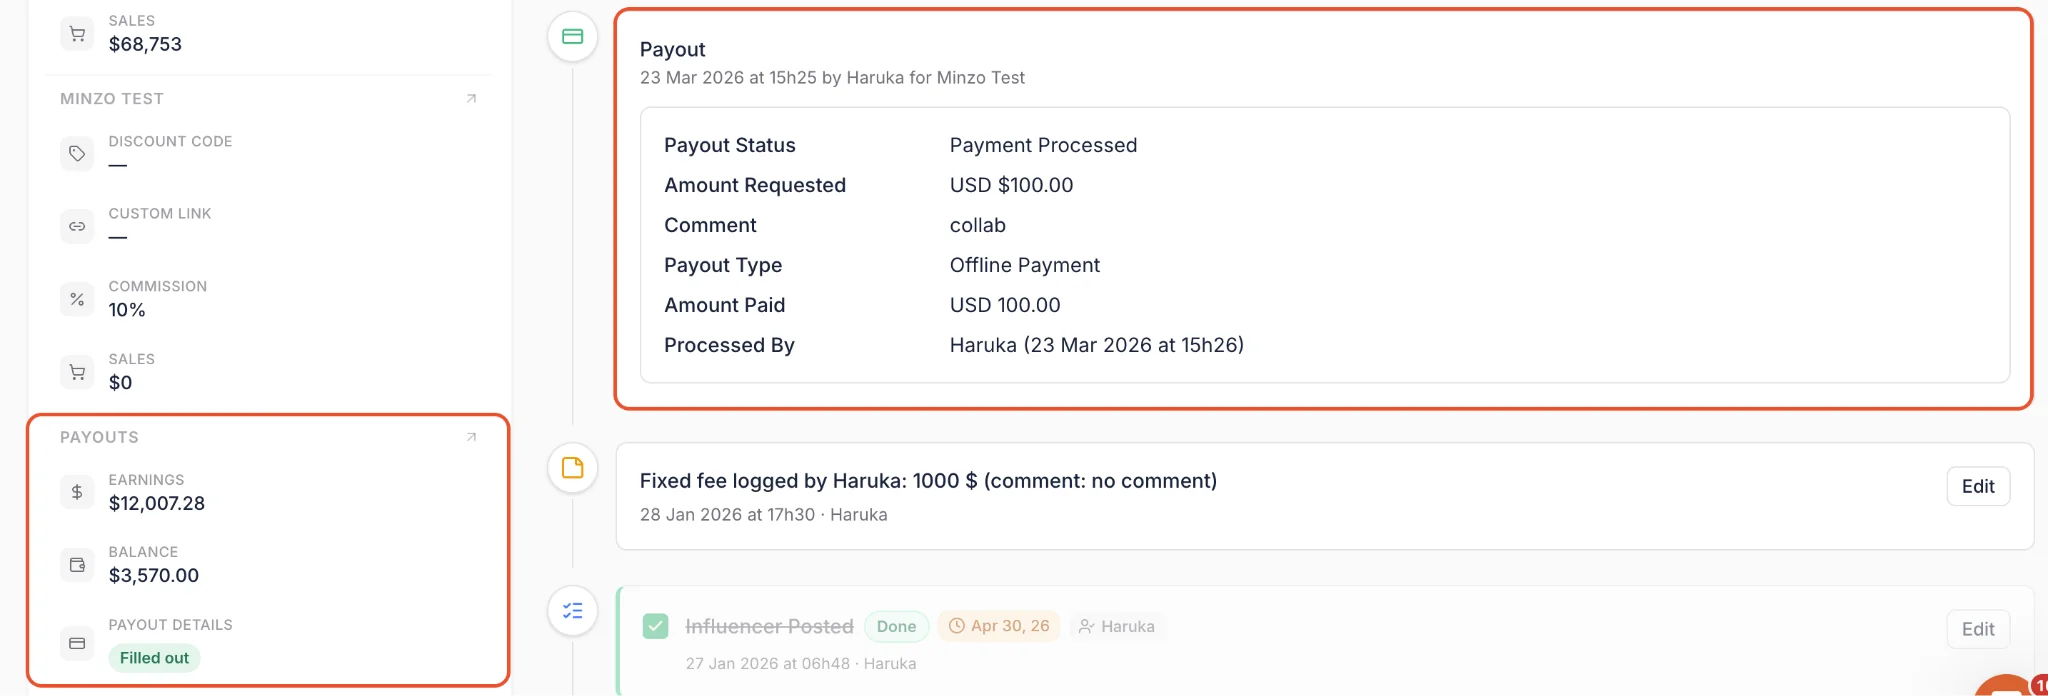
The final step in the reporting workflow is finance. Instead of manual bank transfers and chased paperwork, the Payout Manager centralizes it.
Paying Creators
- Bulk payouts: Select multiple influencers and pay them in one action instead of processing transfers one by one.
- Auto-pay payout requests: Put payouts on a daily, weekly or monthly schedule and pay automatically from a saved payment method. Auto-pay requires that saved method to be set up before you enable a schedule.
- Low transaction fees: Bank debit runs at 0.1% to 0.5% per transaction depending on method and destination, and the $2 Stripe KYC fee has been waived entirely.
- Status-based layout: A structured view shows exactly where every payment stands at a glance.
Collecting Invoices
Payment reporting is only clean if the paperwork matches. Invoicing workflows handle that side automatically.
- Automatic invoice requests: Ask influencers for an invoice manually, or automatically every time a payout is requested.
- Accept or reject with comments: Review submitted invoices from the Payout Manager and reject with a comment if something is missing, prompting a quick re-upload.
- Require invoice before payout: Optionally block a payout from completing until its invoice has been accepted.
The result is a 100% payout-to-invoice match rate for your accounting team without anyone chasing it. Influencers can upload with or without a Creator Dashboard account, invoice settings sit under Payouts > Payout Settings, and invoice events (requested, submitted, accepted, rejected) work as automation triggers.
Financial Audits
Generate weekly or monthly reports showing exactly what has been paid out versus what is owed, which makes budgeting straightforward for your finance team.
Step 7: Exporting for Action
Data is only useful if you can share it. Alongside standard Excel exports, you can generate presentation-ready PDF reports that include all the visual charts and KPIs above.
Whether the audience is a client or your own CEO, these reports turn raw numbers into a professional story of campaign performance.
What You Can Do With Reporting & Analytics
Once a campaign is live, the job shifts from execution to validation. Here is how the suite proves whether your strategy is hitting targets or needs a pivot.
1. Identify Your ROI Drivers
The platform aggregates performance into a clear ranking table inside the Overall tab, so you can see which creators move the needle on conversions and clicks within a specific date range and campaign. Stop guessing, start doubling down on the partnerships that return.
2. Segment Your Roster Instead of Your Campaigns
The All Influencers tab lets you analyze every creator you work with in one view. Filter for high performers with overdue tasks, creators who post consistently but convert poorly, or anyone matching a plain-language description, then act on the whole segment at once.
3. Measure Bottom-Line Profitability
Product costs pull automatically from your connected store, so total COGS tracks against generated revenue without manual entry. You get a transparent view of actual profit margins, which removes the manual ROI calculation work and tells you whether your gifting or paid strategy is sustainable at scale.
4. Validate Your Tier Strategy
Scaling requires knowing which size of influencer resonates with your audience. "Total Influencers by Size" and "Total Likes by Size" show where your budget works hardest, and whether to shift spend toward nano creators for engagement or mega creators for reach.
5. Audit Spend and Financial Health
Beyond total spend and pending commissions, you can audit outreach health through open and response rates, and keep every payout matched to an accepted invoice.
6. Prove Value to Stakeholders
Every dashboard, from affiliate sales to UGC performance and social listening, exports into professional PDF reports. Your team, leadership or clients get presentation-ready proof of how influencer marketing contributes to growth.
When Teams Use Reporting & Analytics
Reporting turns fragmented data into a strategic roadmap. These are the scenarios where teams lean on it hardest.
1. Scaling Affiliate and Sales Performance
The scenario: You are running a month-long sales campaign and need to decide which creators to invite into a long-term ambassadorship.
The workflow: Filter the dashboard by date range to see exactly which orders were referred in that period. Use the ranking table to identify the highest converting influencers, then move those top performers into a higher-commission tier through affiliate tracking.
2. Auditing "Free" Gifting Programs
The scenario: You sent your latest product to 200 micro-influencers and need to justify the spend to finance.
The workflow: Product costs pull automatically from your CMS, so you can view "Total Spend on Product Sendings" against products sent, then compare that cost against generated impressions and EMV to confirm the seeding stays profitable.
3. Optimizing the Recruitment Funnel
The scenario: You are sending hundreds of emails but not signing the contracts you expected.
The workflow: Audit open rates and response percentages. If influencers typically respond after the third email rather than the first, adjust your automated sequences, and let AI follow-up suggestions handle the personalization on each one.
4. Cleaning Up a Roster That Has Outgrown Its Campaigns
The scenario: You have worked with 800 creators across a dozen campaigns and have no idea who is actually worth keeping.
The workflow: Open the All Influencers tab, filter for creators who have posted more than five times but generated below a set sales threshold, save that view for your team, and bulk-send a win-back flow or move them out of active rotation in one action.
5. Refining Your Ideal Creator Profile
The scenario: You want to know whether your budget is better spent on five macro-influencers or fifty nano-influencers.
The workflow: Compare "Total Likes by Size" and "Total Influencers by Size" across tiers to see which group delivers the highest efficiency, then adjust your recruitment targeting accordingly.
6. Managing High-Volume Logistics and Budgeting
The scenario: You work with hundreds of influencers across different tiers and face dozens of individual payouts and stakeholder reports every month.
The workflow: Set auto-pay on a weekly or monthly schedule, require an accepted invoice before each payout completes, and export a presentation-ready PDF for leadership when the month closes.
How Reporting & Analytics Connects With Other Influencer Hero Features
Across most reporting platforms, analyzing a campaign is a separate manual task that happens weeks after content goes live. We built Influencer Hero so reporting is a real-time pulse that informs every other part of the workflow.
Reporting + CRM & Outreach
- Prioritize high performers: Use real-time conversion data to tag your most profitable influencers in the CRM for first access to new campaigns.
- Segment across everything: The All Influencers tab reports on your full CRM rather than one campaign at a time, and lets you action a segment without leaving the view.
- Optimize your funnel: Open rates and response percentages from the Outreach tab tell you when influencers actually reply, so you can rebuild your automated sequences around that timing.
Reporting + Gifting & Payments
- Automated ROI tracking: Product costs pull automatically from your connected store, across Shopify and every other supported platform, so the suite calculates ROI on every product sent without manual entry.
- Automated rewards: Once the suite captures an affiliate sale, the system calculates and processes the commission.
- Payout-to-invoice matching: Invoicing workflows keep every payment tied to an accepted invoice, so your payments reporting reconciles cleanly at month end.
Reporting + Discovery & AI
- Data-driven discovery: If analytics show a specific niche of micro-influencers driving 80% of sales, use the Discovery tool's lookalike filter to find hundreds of similar profiles.
- Tier strategy calibration: Use "Total Likes by Size" to identify which tiers perform, then filter your next Discovery search to that creator size.
Reporting + UGC Collection & Social Listening
- Repurposing top content: The UGC tab highlights your top three performing posts at a glance, and the Content Wall's AI quality sorting and filters help you pull the best assets for paid ads.
- Approving before you report: Content review workflows let you approve or request edits on submissions from the deal page, so what lands in your reporting is content you actually signed off on.
- Social listening: Track mentions from creators outside your CRM, then pull the organic fans into your official outreach workflow.
Keeping your data and your tools under one roof means you are not just tracking a campaign, you are running an engine that saves your team hours of manual work and backs every decision with real results.
Final Thoughts
The best way to understand the Reporting & Analytics suite is to see your own data in it. Whether you are tracking the ROI of a micro-influencer tier through the visual charts, auditing COGS across a non-Shopify store, or segmenting your entire roster in the All Influencers tab, the platform turns raw numbers into a clear strategy.
By connecting reporting directly to your CRM, outreach, gifting and payment workflows, you drop the manual spreadsheets and focus on scaling the partnerships that work. With presentation-ready PDF exports, automated invoicing and real-time outreach health, you move from guessing to knowing exactly what drives your results.
Book a demo with our team to see the platform live and get a walkthrough of how we can help you measure and scale your influencer program.
Summary
This is some text inside of a div block.
This is some text inside of a div block.
Pricing/Month
Shopify Reviews
This is some text inside of a div block.
This is some text inside of a div block.
This is some text inside of a div block.
This is some text inside of a div block.
This is some text inside of a div block.
This is some text inside of a div block.
This is some text inside of a div block.
This is some text inside of a div block.
This is some text inside of a div block.
This is some text inside of a div block.
This is some text inside of a div block.
This is some text inside of a div block.
This is some text inside of a div block.
This is some text inside of a div block.
This is some text inside of a div block.
This is some text inside of a div block.
This is some text inside of a div block.
This is some text inside of a div block.
This is some text inside of a div block.
This is some text inside of a div block.
This is some text inside of a div block.
Read More

FAQs
What metrics can I track within the reporting dashboard?

The platform provides a comprehensive view of your most important campaign KPIs, including total impressions, clicks, and conversions. You can also monitor specific bottom-funnel results like affiliate sales per creator and overall Earned Media Value (EMV).
Can I track the costs associated with product gifting?
Yes. Influencer Hero allows you to analyze your Cost of Goods Sold (COGS) for gifting campaigns by syncing directly with your e-commerce CMS. This helps you track exactly how many products were sent and the total expense involved in your seeding efforts.
Is it possible to see which individual influencers are performing best?
Absolutely. The system features a simple ranking table that identifies your top-performing partners based on their real-time results. This allows you to evaluate performance across different influencer sizes—from nano to mega—and reward those driving the highest ROI.
How does the platform handle influencer payments?
You can track influencer payments by generating weekly and monthly reports to keep your budgeting seamless. To save time, the platform also features a batch processing tool that allows you to handle multiple creator payments at once rather than processing them manually.
Can I share these reports with my team or clients?
Yes. All charts and reporting features are designed for easy understanding. You can generate exportable reports and ROI dashboards to share real-time performance visibility and campaign breakdowns with stakeholders or internal teams.




Most Popular Blogs


Drive ROI With Influencer Marketing
Join 1,200+ brands and 150+ agencies scaling creator programs with Influencer Hero.