
August 29, 2025

10 Min
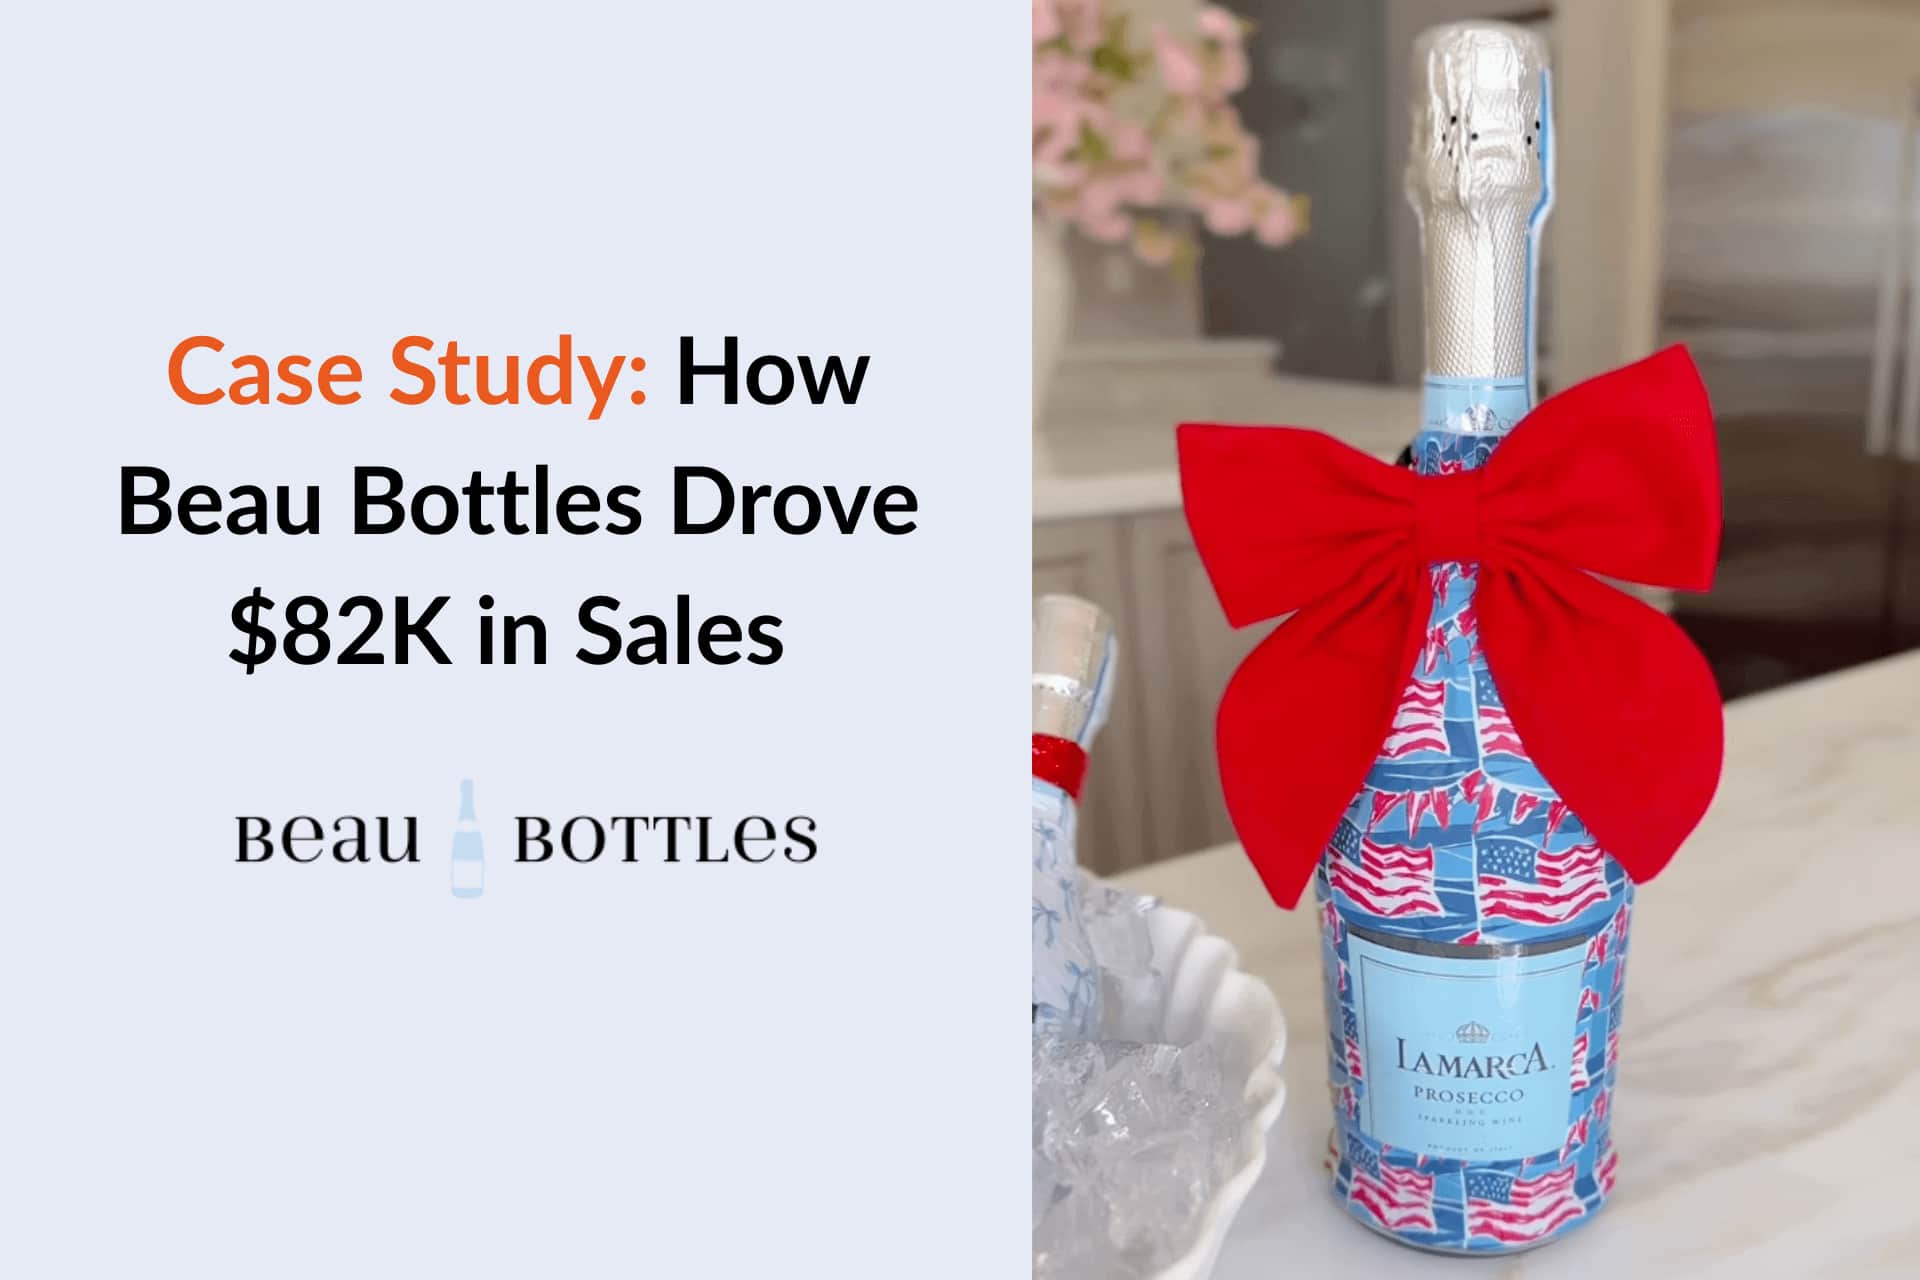
Case Study: How Beau Bottles Drove $82K in Sales and Viral UGC Using Influencer Hero


%20(1).jpg)


LinkedIn is a professional networking platform that hosts over 1 billion registered users around the world and over 55 million companies maintaining LinkedIn pages, making it a top platform for B2B marketing and corporate communications. Whether you are building your personal brand, running campaigns for brands or managing a company page, understanding your LinkedIn Engagement Rate (ER) is crucial for crafting an effective content strategy.
Engagement Rate (ER) tells the platform how interested your audience is with your posts and how actively they interact through likes, comments and shares. A strong Engagement Rate it’s a clear sign of how much your content resonates with your target audience, improving visibility within LinkedIn’s algorithm and driving valuable business outcomes.
In this article we’ll explore the formula to calculate Engagement Rate, calculation steps, benchmarks by industry, real life examples and tips and strategies to boost your engagement. Let’s dive in!
Engagement Rate (ER) is a metric used to measure the level of interaction your content receives from your audience.
On LinkedIn, this interaction typically includes:
Engagement Rate takes into account every way the audience has to interact with your posts to determine the impact your content has.
To drive a successful marketing campaign there are other key metrics as well, but measuring Engagement Rate will give you a clear picture not only about how much your content is being seen but also the conversations it’s starting and the relevance it has to your target audience.
Quick note: clicks and follows can technically be part of LinkedIn’s interactions but as they aren't always visible in public posts, it's okay to omit them for manual calculation.
There is a simple formula to know how to calculate your Engagement Rate (ER) on LinkedIn:

Let's make it clearer with an example! Let’s say you share a LinkedIn post and got:
Going back to the formula:
In this scenario, your post had a 4.05% ER. However, if you were wondering about your ER over time or you’d rather know how your overalls page engagement is, there’s another slightly different formula.
This formula is used when you want to measure more than just individual posts.

Let’s take the same example for a better understanding! Let’s keep the same interaction and assume we have a 5,000 followers base.
In this scenario, based on your interaction and total followers, your ER is 3.40%.
You can use the ER by Impressions formula for measuring campaign and post performance and ER by followers for measuring audience loyalty over time.
The key to running a successful marketing campaign is to always know your goal and the proper metric to measure it!
Engagement Rate is a metric you should always be looking out for. The main reason why is that the stronger your engagement, the more LinkedIn’s algorithm is going to boost your posts visibility.
Why? Engagement shows people really care about your content. Every reaction, comment and share signals that what you are sharing is worth time to stop and read and interact with you.
Besides being a good thing in terms of the platforms algorithm, your Engagement Rate:
Monitoring your Engagement Rate on LinkedIn is key for your growth on LinkedIn. You can do this manually or using different marketing analytics tools for more organized comparisons.
Your level of engagement can vary based on your type of content and audience size. However, there are some general averages that suggest that:
You can track your Engagement Rate in different posts over time and compare your results to the benchmarks or even use the formula to guess your competitors result to get an even better idea of how your campaign is performing, and if needed, make the necessary adjustments.
Your Engagement Rate can also be determined by the industry you are posting about. Understanding how your LinkedIn Engagement Rate compared to industry standards is crucial for evaluating the effectiveness of your content and engagement strategies. Here’s a quick breakdown of average Engagement Rate across different popular sectors on the platform:
Quick note: ER is calculated by Impressions.
While Engagement Rate is a powerful metric to use, it does not always tell the whole story, especially with massive audiences.
Gary Vaynerchuck is an entrepreneur and CEO of VaynerMedia. He’s highly relevant on LinkedIn for consistently sharing actionable business advice, championing authentic content, and setting trends in personal branding and audience engagement.

Let’s take a look at his profile and calculate the Engagement Rate of one of his latest posts. Given that we don’t have access to the total impressions his posts have, we have to stick to the Engagement Rate by followers formula.

At first sight, this Engagement Rate seems very low and may lead you to believe that Gary is not one of the strongest LinkedIn’s influencers. However, in 2023 he was recognized as one of LinkedIn’s Top Voices, to celebrate his influential content and active interaction with his community.
How is this possible? Typically influencers with a huge amount of followers have a lot of them as passive users or simply observers. That’s why a seemingly “low” Engagement Rate can still reflect strong performance in context.
The takeaway? Don’t be discouraged by low numbers, focus on providing your audience with quality content and use Engagement Rate as a benchmark to track your own growth and performance over time.
When calculating Engagement Rate it’s truly important to know whether you are measuring the performance of a single post or analyzing the engagement across an entire page (company or creator profile).
This is used when you want to measure how engaging a specific post was. The formula is:
This will tell you how well your posts perform individually and how much each one of them resonates with your audience.
This is used when you want to analyze the overall engagement on all posts during a specific period. The formula is:
This gives a broader view of how engaged your audience is with your content strategy over time.
When should you use each one? If you want to test and optimize your content, ER per post is the ideal strategy. On the other hand, if what you are looking for is insights into long-term performance and audience health, ER per Page is the way to go.
If you're struggling with your ER, don’t panic. When it comes to engagement, quality content, good timing and genuine connection with your audience is the perfect combo for getting better results.
Here are some strategies proven effective if you are a brand, creator, founder or company!
Posting a random post without any strategy behind it and expecting good results is not realistic. In order to increase your engagement on LinkedIn you must:
Create a schedule of different posts per week or month and stick to it. Consistency is the key to every marketing strategy.
Aim to post content regularly and don’t let weeks go by without sharing content. Typically Tuesdays and Thursdays are LinkedIn’s peak engagement days, but see how well your posts perform on different days of the week and imitate that when you plan ahead.
Unlike any other social media, at LinkedIn text posts consistently overperform other formats. Long posts are great, especially when they tell a personal story, share value or an expert opinion.
No matter the case, you should always keep your content readable:
Always add calls to action (CTAs) to encourage your audience participation. You can use prompts like:
Comment on relevant posts, reply to every comment on your own, and be active in your niche. Engagement attracts engagement.
Seek for a personal connection with your audience. Your posts are going to be shown more to the people you are connected or frequently interact with.
Keeping the relevance of your content is going to increase your posts visibility as well. You can use:
Share experiences, insights, or opinions that resonate with your audience’s needs or goals. People connect with real, human content.
Engagement is a really important thing to look after in every marketing campaign you embark on. However you don’t need to obsess over those numbers, it’s better if you think about your content, the context of your account and the kind of interactions you want to establish with your followers.
ER can be just used as your own benchmark to track your performance over time and keep getting better on the platform!

Impressions count how many times your post was displayed on someone's feed, even if seen multiple times by the same person. Reach, on the other hand, refers to the number of unique users who saw your content. While LinkedIn primarily shows impression data, understanding the distinction helps you analyze visibility vs. actual audience size.
LinkedIn’s algorithm prioritizes posts that quickly generate engagement—especially in the form of comments and reactions—from your first-degree connections. It evaluates dwell time, interaction quality, and relevancy to show content to more users. Posts that encourage meaningful discussions are favored for broader distribution.
Text-only posts that tell a personal or professional story often perform best, followed by carousel documents and short-form videos. Posts that include clear value, vulnerability, or thought leadership tend to spark the most engagement. Avoid overly promotional content and aim for educational or emotionally resonant posts.
You can analyze competitors’ public posts manually by tracking their reactions, comments, and shares and comparing it to their follower count to estimate ER. Tools like Shield, Hootsuite, or Socialinsider also offer benchmarking features to compare performance metrics across industry peers.
Yes—timing can significantly impact visibility and engagement. Posts published during business hours (especially Tuesday through Thursday, between 9 AM and 11 AM) generally perform better. However, analyzing your audience’s behavior using analytics tools or A/B testing different times can yield the most personalized results.
Schedule a Demo with one of our media experts below.