

August 29, 2025

10 Min
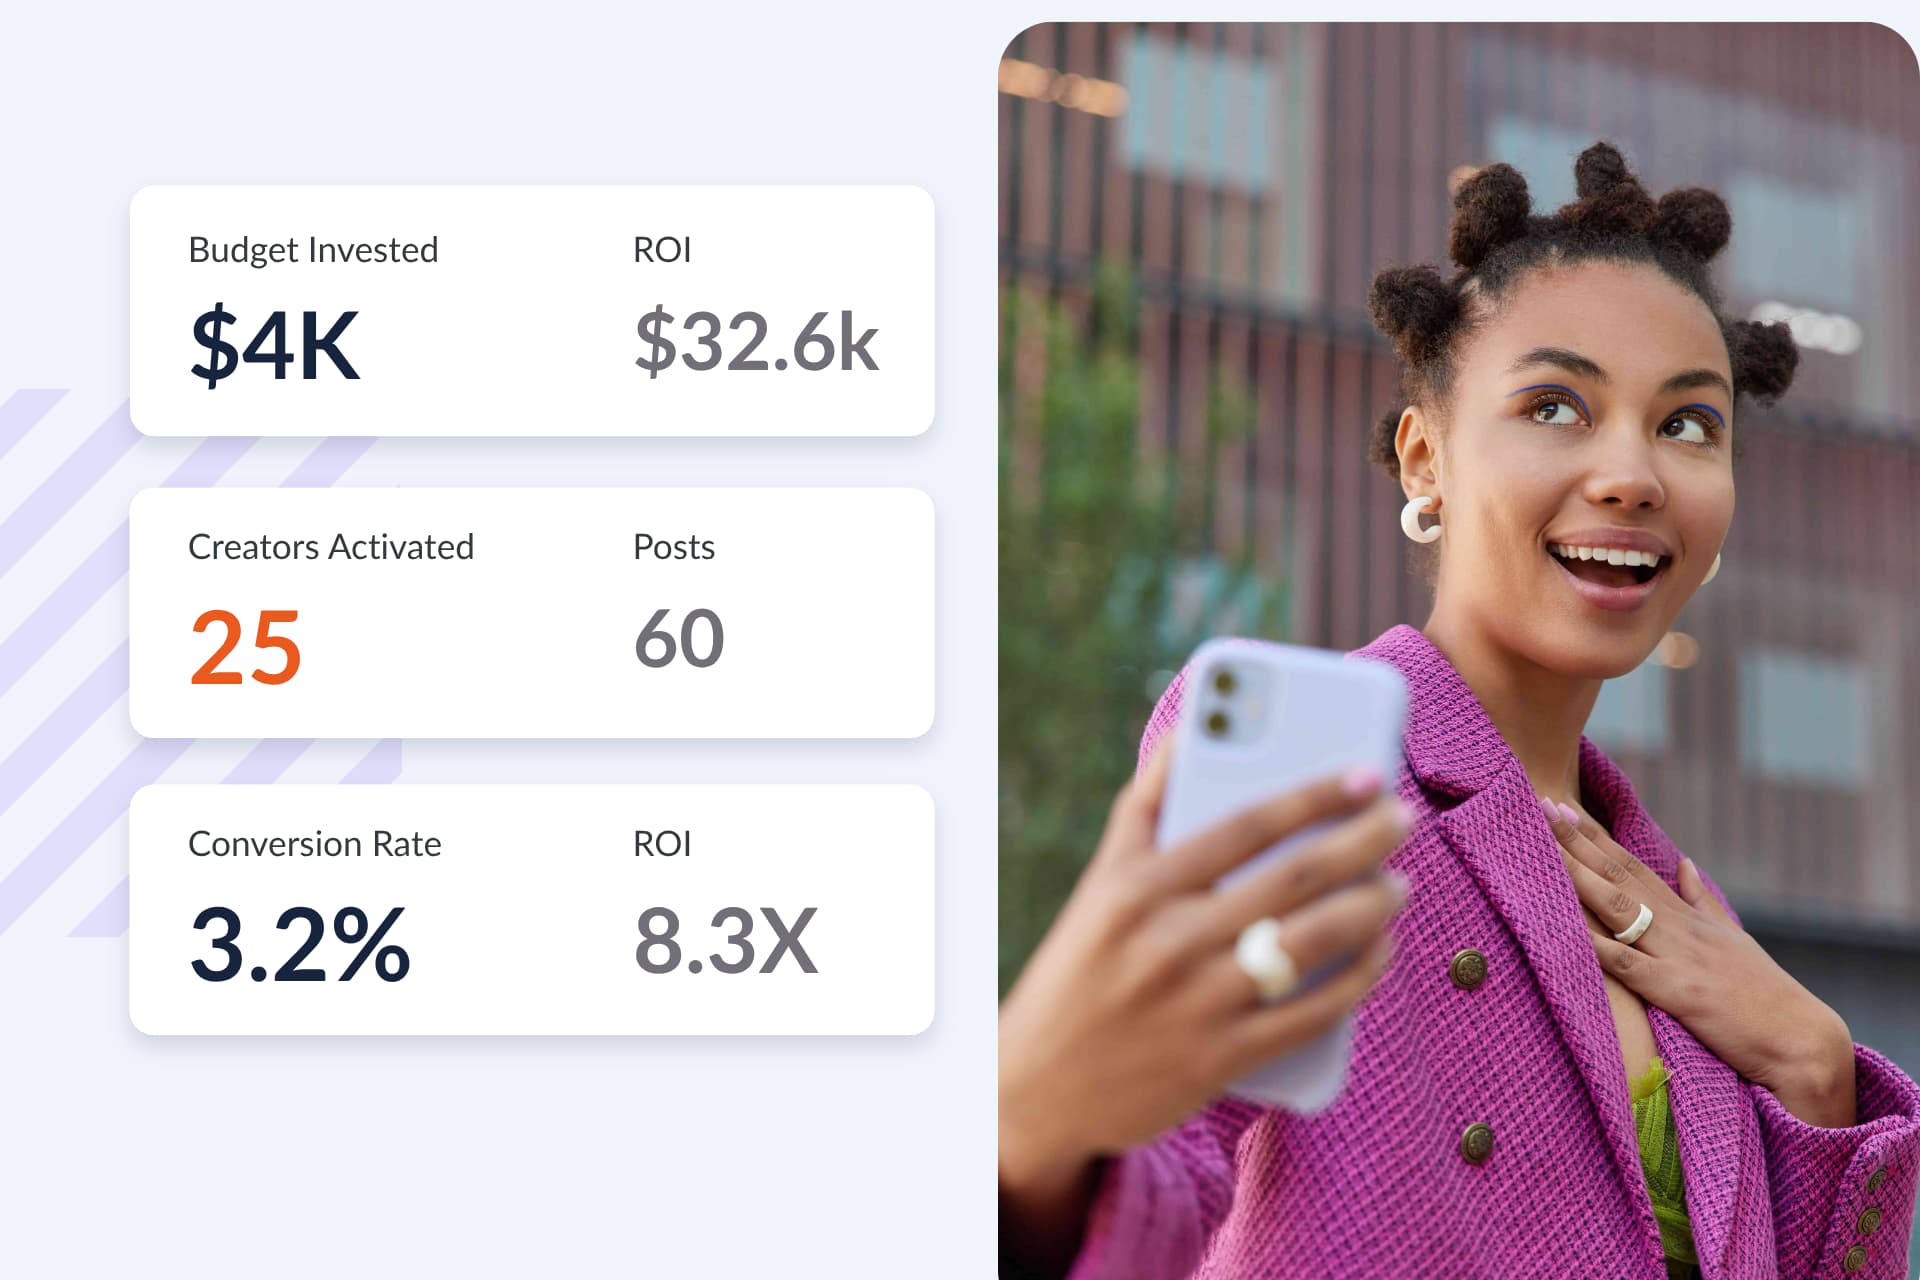
Case Study: How Beau Bottles Drove $82K in Sales and Viral UGC Using Influencer Hero


Most brands track influencer performance the wrong way - focusing on likes, comments, and impressions, while completely missing the metrics that actually drive revenue. With media costs rising and every marketing dollar under pressure, knowing what to measure (and how to measure it) is the difference between a scalable influencer program and one that quietly burns budget.
In this article, you’ll learn the core KPIs that matter across the funnel - from awareness to engagement to conversions, ROIS, CAC, and customer value. You’ll learn the exact attribution tools that top-performing teams use, when to rely on affiliate links and discount codes, how to measure earned media value, and how to build performance reports that align influencer marketing with broader business goals.
Take the full Influencer Performance Marketing Course and get certified!
Measuring influencer performance starts with choosing the right attribution tools. For revenue-focused campaigns, the most accurate way to track results is through affiliate links and unique discount codes - together, they give you a full picture of clicks, conversions, and revenue generated per creator.
Affiliate links allow you to measure:
Because you’re getting data directly from your site or tracking platform, affiliate links provide the cleanest bottom-of-funnel insight.
Discount codes act as a secondary attribution layer.
They help capture purchases from followers who didn’t click the affiliate link (e.g., they typed the brand name manually or returned later).
In most industries, affiliate links + discount codes combined capture ~70% of total sales - which is why both are essential for accurate reporting.
Top-of-funnel metrics still matter, especially for brands investing in broader awareness campaigns. However, accessing these metrics can be challenging:
This is normal - most brands combine automated tracking (for clicks and conversions) with creator-provided screenshots (for impressions, views, reach, and engagement).
Ultimately, every program should measure both - but your primary KPI should match your business model and growth stage.
While revenue and conversions sit at the bottom of the funnel, your creators’ ability to drive attention and interest determines whether those conversions happen in the first place. These top- and mid-funnel metrics help brands understand how potential customers are discovering, engaging with, and evaluating your product before they buy.
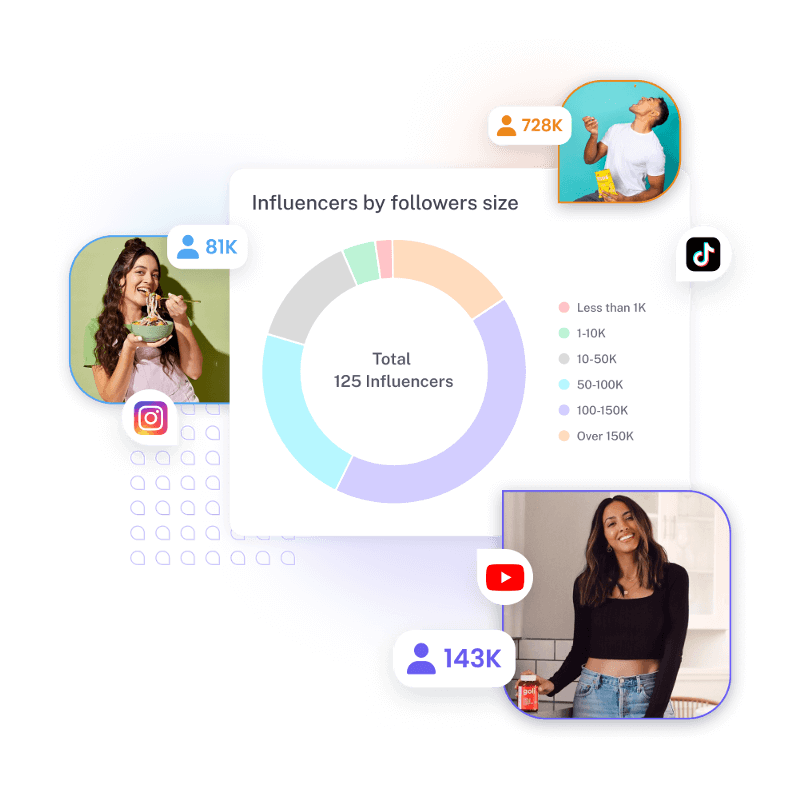
Below are the core KPIs every marketer should monitor in awareness and consideration-focused influencer campaigns.
The total number of times content is displayed.
The number of unique users who saw the content.
The cost to reach 1,000 people.
Interested in learning how to measure CPM? Check our guide with our free CPM calculator.
The increase in the creator’s (or brand’s) audience during a campaign.
The formula to calculate engagement rate is:
ER = Interactions (likes + comments) / Followers
Not all engagement is created equal.
Metrics like:
…help you understand deeper consumer behavior and whether the content created real value.
The percentage of users who clicked from a creator’s content to your landing page.
Together, TOF and MOF KPIs let you understand not just who saw a creator’s content — but whether the content created meaningful momentum toward the sale.

Bottom-of-funnel (BOF) metrics are where influencer marketing becomes a performance channel rather than a brand awareness activity. These KPIs show which creators truly drive sales, profitability, and long-term customer value - and which ones drain your budget.
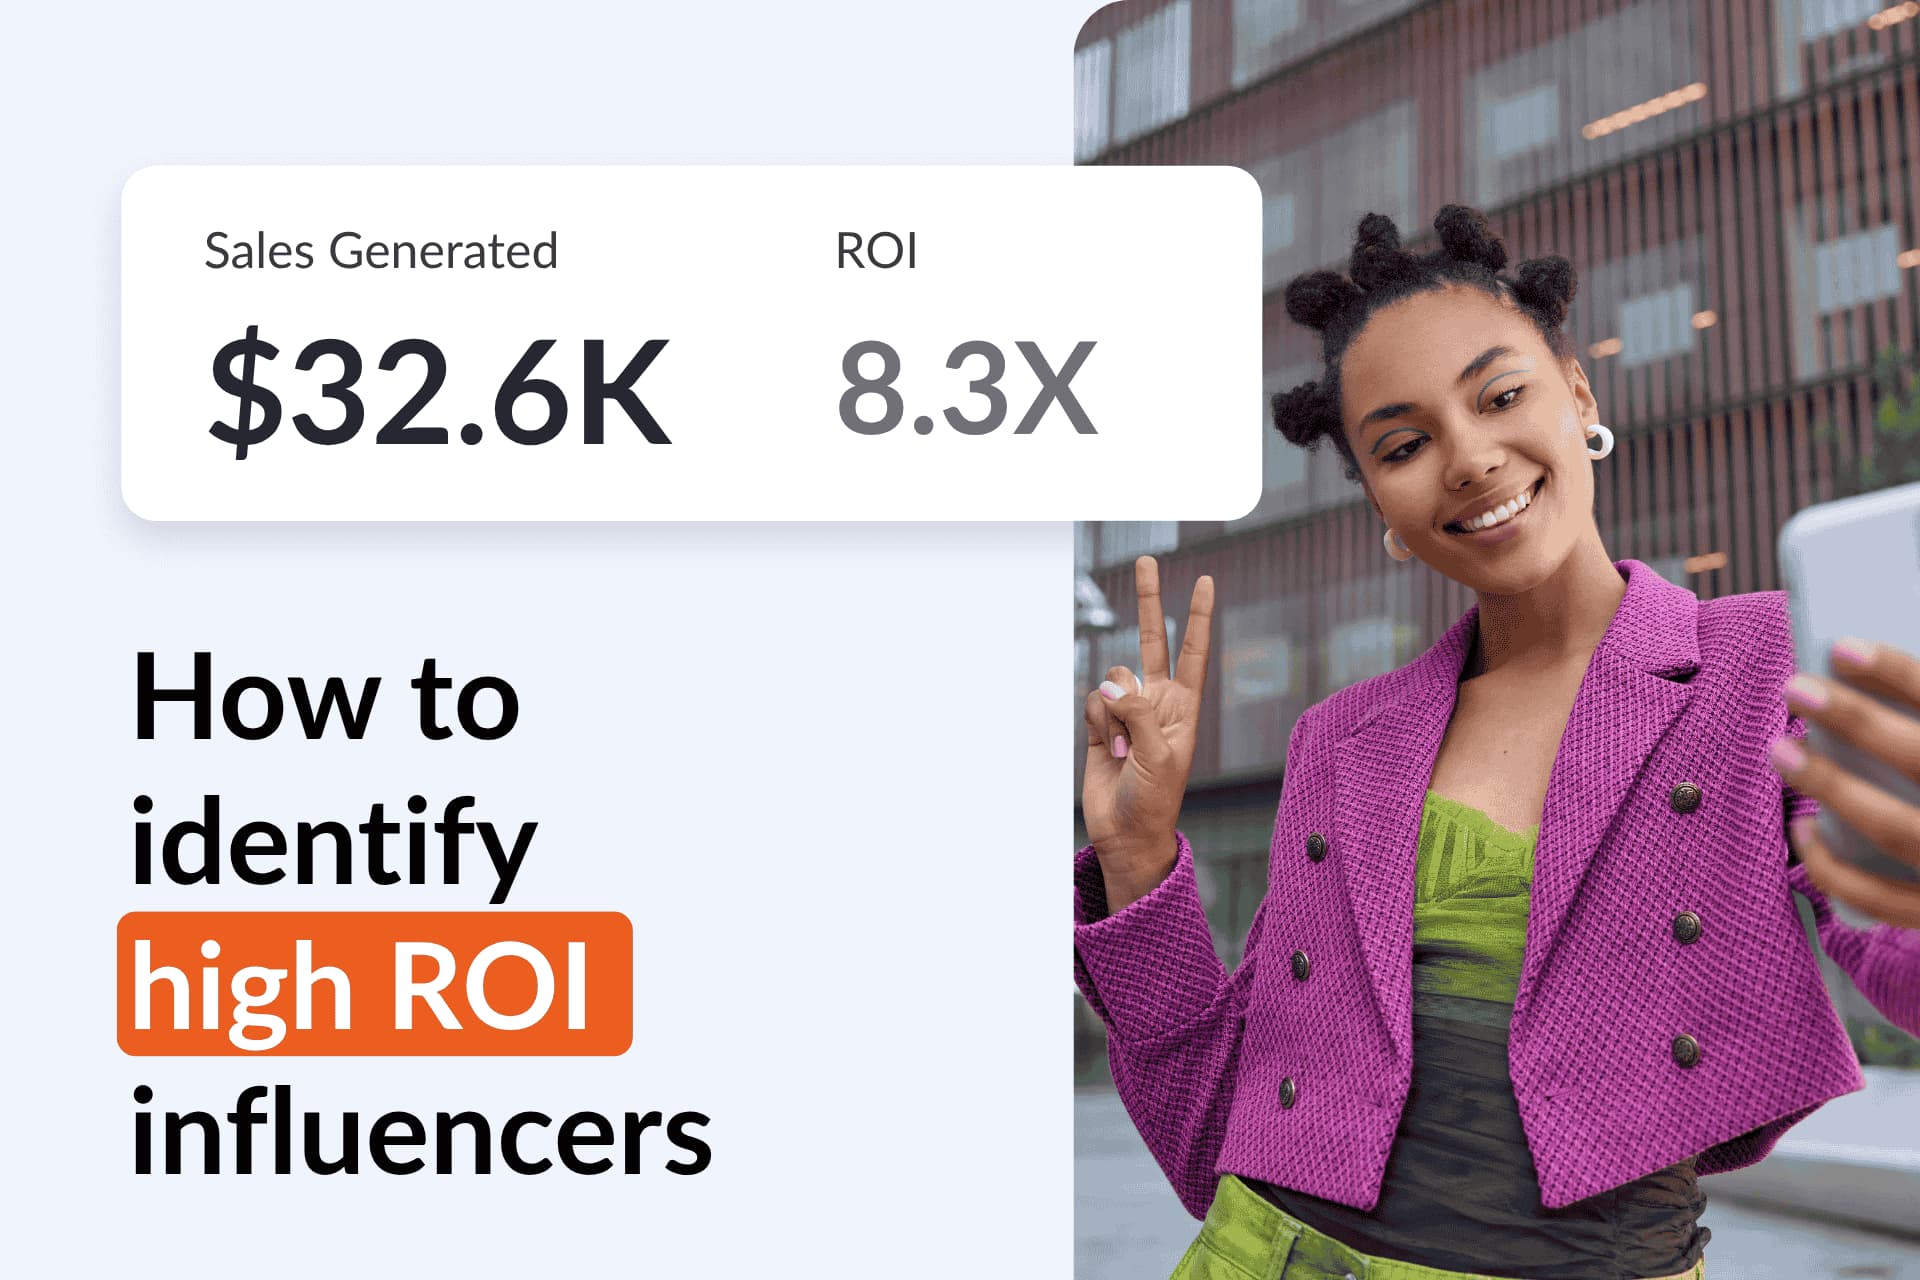
If your goal is measurable ROI, these are the metrics that matter most.
The total dollar value driven by each creator.
Revenue is the foundation of every performance-driven influencer program. Without it, you can’t scale profitably.
Also referred to as ROAS, but ROIS is more accurate for influencer programs since the costs are not ad platform spend.
ROIS = Revenue Generated / Influencer Spend
Includes:
ROIS shows the true financial impact of your influencer activity. Brands aiming for sustainable results typically target 3x–10x ROIS, depending on margin structure.
CAC = Total Influencer Spend / Number of New Customers Acquired
A critical metric when you need to compare influencer performance against other acquisition channels like Meta Ads or Google.
CAC determines whether influencers are more cost-efficient than other paid channels — and whether scaling is feasible.
How much a customer is worth to the brand over time. This is especially important for products with strong repeat purchase behavior (skincare, supplements, apparel, etc.).
Some creators may appear “expensive” on first purchase but deliver high-value customers who buy multiple times. CLTV helps you distinguish between high-quality and low-quality acquisition.
AOV = Total Revenue / Number of Orders
Higher AOV means influencers are attracting customers who purchase more per transaction — strengthening profitability and ROIS.
CR = Conversions / Clicks
Measures how effectively a creator’s content and link drive purchase intent.
A high CR indicates strong product-audience match, persuasive content, and high creator trust.
CR is often more valuable than impressions or engagement when selecting creators for paid partnerships or whitelisting.
Larger corporations may prioritize TOF branding, but for most consumer brands, BOF metrics are what justify budget increases and enable true performance scaling.
Earned Media Value (EMV) is one of the most useful upper-funnel KPIs for brands investing in influencer marketing. It assigns a dollar value to the exposure generated by creators - allowing you to compare influencer reach directly against what you would have paid for similar results through paid advertising.
In other words: EMV tells you how much the same impressions would have cost if you ran them as ads on Meta, TikTok, or YouTube.
For brands running hybrid strategies (influencer + paid ads), EMV is one of the cleanest ways to quantify the “brand lift” side of the program.
The formula is simple:
EMV = (Impressions / 1000) x CPM
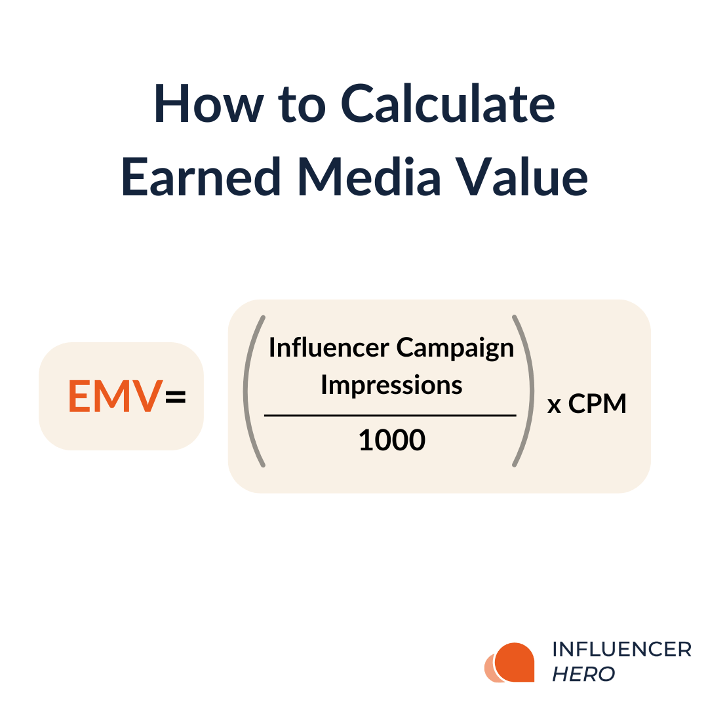
Where:
To avoid underestimating value, brands use a premium CPM (usually 50–100% higher) because influencer content often delivers stronger engagement, watch time, and social proof than standard ads.
CPM varies widely by platform, audience, country, and season. A simple rule of thumb:
Other examples:
These premiums account for the higher trust and authenticity of UGC compared to traditional ads.
Let’s look at a real example of an influencer post that went viral with 54.7 million views.
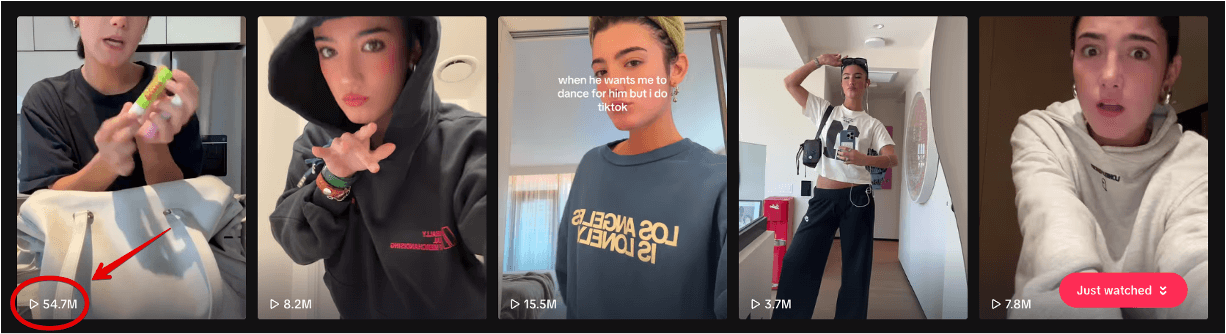
Step-by-step calculation:
EMV = 54,700,000 / 1,000) x 15 = $820,500
EMV shines in campaigns where brand lift is as important as immediate conversions, such as:
For performance-led D2C brands, EMV complements revenue metrics by highlighting the full scope of value beyond just tracked conversions.
A well-built report does more than show numbers - it tells a clear, strategic story. Whether you're presenting results to a CMO, a founder, or a client, your report should show what worked, what didn’t, and what should happen next.
Start with summing up the most important KPIs including TOF, MOF & BOF KPIs. To make it easier simply create a copy of our reporting template which you can access here.
This section breaks down exactly what to include, how to structure it, and how to make your insights actionable.
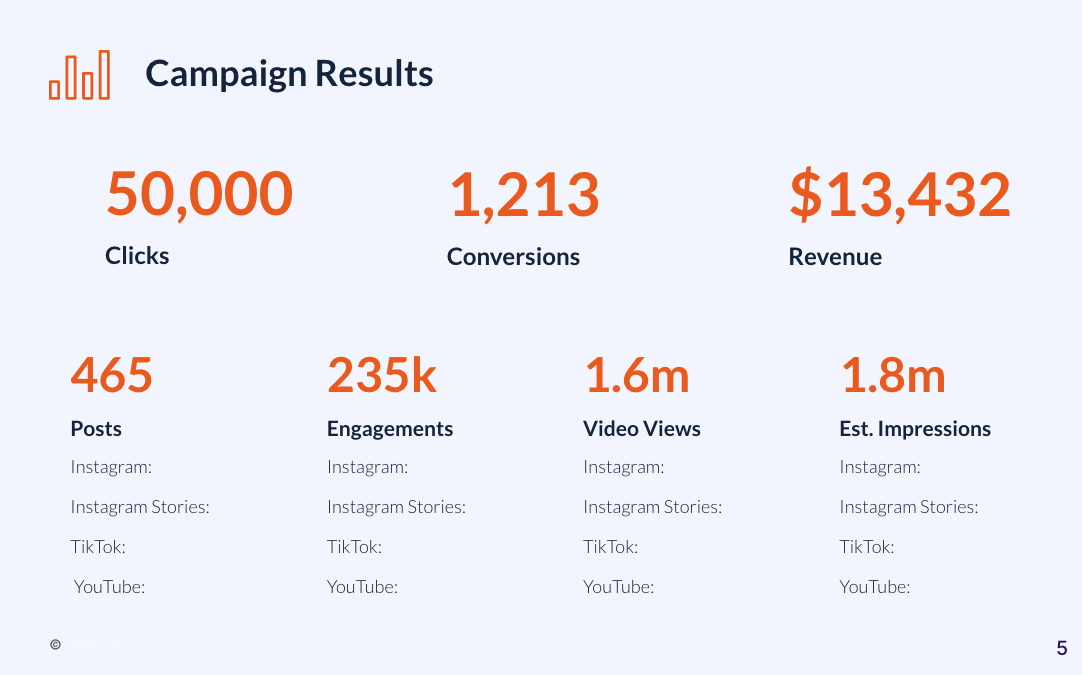
Open your report with a snapshot of performance across the funnel. Include a simple, clean section summarizing:
This gives stakeholders a complete picture at a glance.
After showing results, show what you spent to achieve them. This includes costs such as:
This section is essential for validating ROI and budgeting future campaigns.
This is one of the most important parts of an influencer report - especially for leadership teams trying to understand what’s driving growth.
Accompany this with a visual table showing at minimum:
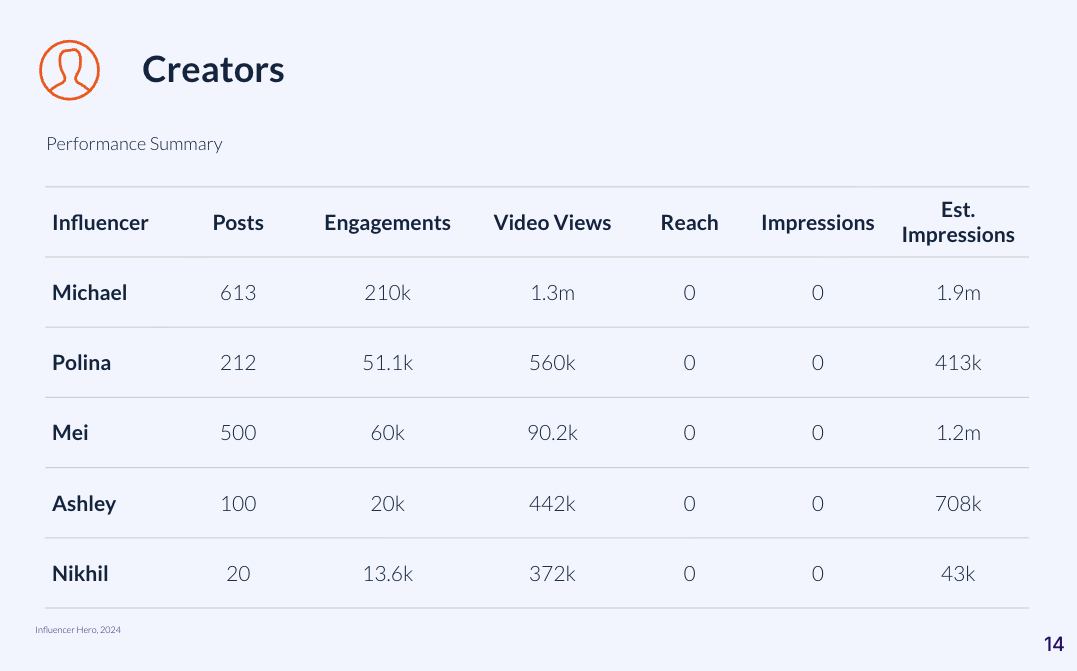
This table makes it immediately clear who should be reactivated, upgraded, or moved into fixed-fee partnerships for future campaigns.
Instead of listing metrics only, show the actual photos, Reels, or TikToks that performed best.
Include:
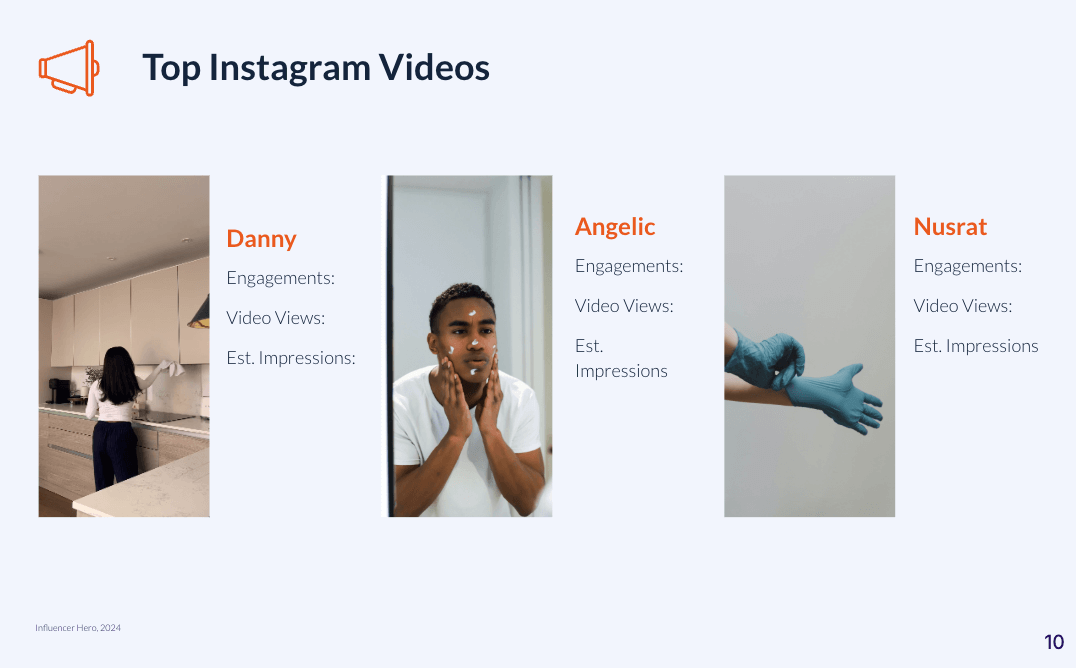
This turns raw data into actionable creative strategy.
Data is useless without interpretation. Include a concise insights section, such as:
This shows leadership that you’re not just tracking results - you’re learning from them.
End with a section that tells the team exactly what to do next. Examples:
This is the section CMOs care about the most - what the data means for growth.
If you’re an agency, standard reporting ensures consistency across clients. If you’re a brand, it ensures clean internal communication.
Tools like Influencer Hero allow you to automatically generate reporting dashboards that combine:
This reduces manual reporting time and eliminates errors.
Influencer marketing becomes truly scalable only when brands treat it like a performance channel, not a gamble. Tracking the right metrics gives you visibility into the full funnel: how people discover your brand, how they interact with creators, and ultimately, how many convert into paying customers.
With accurate attribution (affiliate links + discount codes), clear KPIs across the funnel, and structured reporting, you can identify your top-performing creators, optimize budget allocation, and build campaigns that compound over time.
If you're ready to build a performance-driven influencer program with accurate attribution, automated reporting, and a full creator CRM, book a demo and see how top brands track and scale their influencer ROI with ease.
Key Takeaways
Continue learning: How to Budget, Forecast, and Finance a Performance-Driven Influencer Campaign

The highest accuracy comes from using affiliate links + unique discount codes together. Links track clicks and conversions, while discount codes capture sales from users who purchased later or via a different device. Combined, they typically capture about 70% of total attributable sales.
For performance-driven brands: Revenue, ROIS (Return on Influencer Spend), CAC (Customer Acquisition Cost) For awareness-focused campaigns: Impressions, Engagement rate, CTR
The right KPI depends on whether your campaign objective is branding or conversions.
Look for creators with: High ROIS, Consistent sales per post, Strong CTR, High audience credibility (low fake follower %). These creators become your “High Performers” and should be prioritized for seasonal campaigns and paid partnerships.
Most high-performing D2C brands target 3×–10× ROIS depending on margins. For high-LTV products (skincare, supplements), ROIS can be lower because repeat purchases increase long-term value.
Schedule a Demo with one of our media experts below.