Top 11 Analytics Tools for Growth Focused Marketers
Data-driven growth isn’t just a buzzword—it’s what separates brands that scale fast from those that get stuck. In fact, according to a report by Forbes, companies that adopt data-driven marketing are six times more likely to be profitable year-over-year.
However, the challenge isn’t deciding whether to use analytics—it’s knowing which tools will actually help you turn numbers into decisions that move the needle.
That’s exactly what we’ll cover in this article. From platforms that track influencer ROI to solutions built for web traffic, customer behavior, and campaign attribution, we’ll walk through the top analytics tools growth-focused marketers should consider in 2025.
Here’s the list of tools we’ll break down:
Influencer Hero
AppsFlyer
Google Analytics
Adobe Analytics
Hubspot
Woopra
Crazy Egg
Ahrefs
Domo
HockeyStack
Mixpanel
What To Look For In An Analytics Tool
For growth-focused marketers, the right analytics tool isn’t just about collecting numbers — it’s about uncovering patterns that fuel faster decisions and measurable ROI. When evaluating tools, keep these priorities in mind:
Cross-Channel Visibility: Growth rarely happens in silos. Look for platforms that bring together data from multiple sources — social media, paid ads, email, website traffic, and influencer campaigns — so you can see the bigger picture and spot which channels are truly driving growth.
Attribution and ROI Measurement: Marketers need to tie spend directly to results. Choose tools that offer clear attribution models and revenue tracking, whether it’s first-click, last-click, or multi-touch, so you know exactly what’s moving the needle.
Scalability and Integrations: As your campaigns grow, your data needs will grow too. The best analytics tools integrate smoothly with CRMs, ad platforms, and e-commerce systems—and if your team is evaluating CDP vs CRM, this flexibility becomes even more important—ensuring your team doesn’t get stuck exporting endless spreadsheets.
Behavioral Insights: Go beyond traffic numbers — insights into customer journeys, drop-off points, and repeat purchase behavior are crucial for identifying bottlenecks and improving conversion rates.
Real-Time Alerts: Growth marketing often requires quick pivots. Tools that provide live updates or alerts on sudden traffic spikes, campaign underperformance, or viral content allow you to act in the moment.
Experimentation Support: Look for built-in A/B testing tools or experiment tracking features. Being able to test creative, messaging, or audience targeting — and quickly learn what works — is at the core of sustainable growth.
Niche Specialization: Sometimes, general tools aren’t enough. If you’re focused on influencer marketing, for example, tools like Influencer Hero give you campaign-specific analytics that a general web analytics tool won’t capture. Similarly, SEO-driven brands may lean on Ahrefs for keyword and backlink insights. The right niche tool helps you go deeper where it matters most.
Criteria of Selection: How We Evaluated the Best Analytics for Growth Marketers
When curating this list of analytics tools, we focused on factors that matter most to growth-driven teams — from D2C brands to agencies managing multiple clients. Each tool was evaluated based on the following criteria:
1. Growth-Focused Features
We prioritized tools that go beyond surface-level metrics. This includes attribution modeling, customer journey tracking, revenue impact analysis, and the ability to measure marketing ROI across multiple channels.
2. User Feedback & Industry Reputation
The best validation comes from the marketers already using these tools. We factored in reviews from trusted platforms like G2, Capterra, and case studies that highlight how these tools perform in real-world scenarios.
3. Pricing & Value for Money
Budgets matter, especially for scaling D2C brands. We evaluated whether each platform offers transparent pricing, flexible tiers, and trial periods — ensuring accessibility for startups while still providing advanced capabilities for larger teams.
4. Usability & Integrations
An analytics tool is only as powerful as it is usable. We assessed dashboards, reporting flexibility, and integration options with popular CRMs, ad platforms, and e-commerce systems to ensure seamless adoption.
5. Flexibility & Scalability
Growth rarely looks the same quarter to quarter. We gave preference to tools with contract flexibility, scalable features, and the ability to adapt as campaigns expand — without forcing teams into rigid, long-term commitments.
Top 11 Analytics Tools
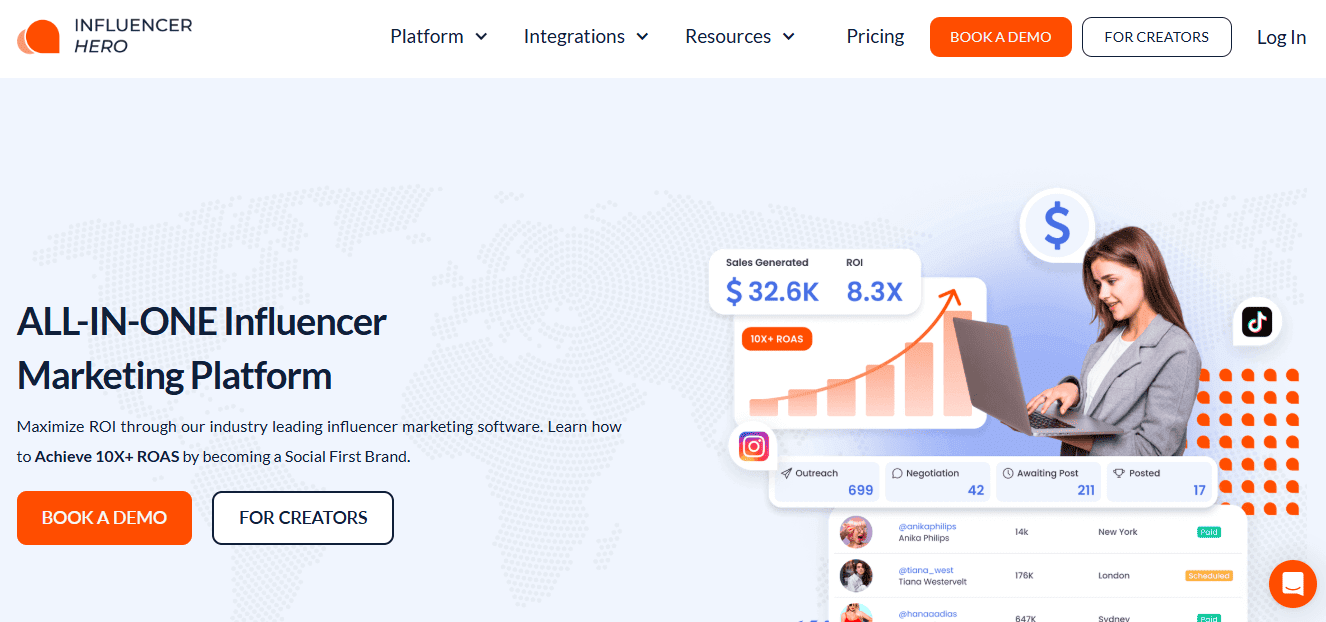
1. Influencer Hero
Best For: D2C and eCommerce brands on Shopify, WooCommerce, or Amazon — as well as agencies — looking to scale influencer and affiliate campaigns with deep performance analytics and ROI tracking
Pricing:
Standard – $649/month (up to 1,000 creators)
Pro – $1,049/month (up to 5,000 creators)
Business – $2,490/month (up to 10,000 creators)
Custom & Agency Plans – Tailored pricing based on brand needs
All plans include full analytics and can be scaled as programs grow
Reviews 5.0 / 5.0 on Capterra
Ease of Use (UX/UI): Influencer Hero is known for its intuitive design and streamlined dashboard, with drag-and-drop campaign setup, automated workflows, and customizable email templates. Users consistently highlight how the platform reduces manual work while making complex analytics easy to digest.
Customer Support: Support is one of Influencer Hero’s strongest differentiators. Every customer receives a dedicated account manager from day one, plus access to 24/7 real-human live chat, responsive email support, and an extensive Help Center filled with written and video tutorials. Pro plan users also gain access to a private Slack channel for faster, continuous support and optional strategy consultations to guide campaign growth
Influencer Hero Analytics Features
Real-Time Dashboards: Track campaign performance across reach, engagement, clicks, and conversions in one central hub.
ROI Per Influencer: Attribute revenue impact at the creator level with clear affiliate sales and commission tracking.
Content Performance Analytics: Measure impressions, engagement, and growth trends for individual posts, Stories, and videos.
Affiliate & Conversion Tracking: Monitor sales generated through custom links, discount codes, and UGC repurposing.
Predictive Analytics: AI-powered forecasts that estimate likely campaign outcomes based on past performance.
Exportable Reports: Create and share detailed, branded reports with stakeholders for strategy reviews and client updates.
Brand-Following Insights: Identify creators who already engage with your brand, adding a layer of authenticity and improving campaign results.
Influencer Hero Pros and Cons
Pros
Cons
Comprehensive Analytics: Real-time dashboards, ROI tracking per influencer, and predictive analytics for campaign performance
Influencer-Focused: Best suited for influencer and affiliate marketing, not a general analytics solution for all channels.
Ease of Use: Intuitive dashboard, drag-and-drop workflows, and automated reporting that save hours each week.
Learning Curve for Niche Features: Teams new to influencer marketing may need onboarding to fully leverage advanced analytics.
Scalable Pricing: Flexible plans that grow with brand and campaign needs.
Premium Support: Dedicated account manager, 24/7 chat, private Slack for Pro users, and strategy consultations included.
Our Insights
Influencer Hero is more than just an analytics solution — it’s an all-in-one influencer marketing platform with powerful features for discovery, outreach, and campaign management.
The platform acts as a powerhouse for performance tracking, giving brands real-time dashboards, ROI-per-influencer reporting, predictive analytics, and conversion tracking that connect creator activity directly to revenue. This balance of broad functionality with deep analytics strength makes Influencer Hero a top choice for D2C brands and agencies that want both streamlined workflows and actionable growth insights.
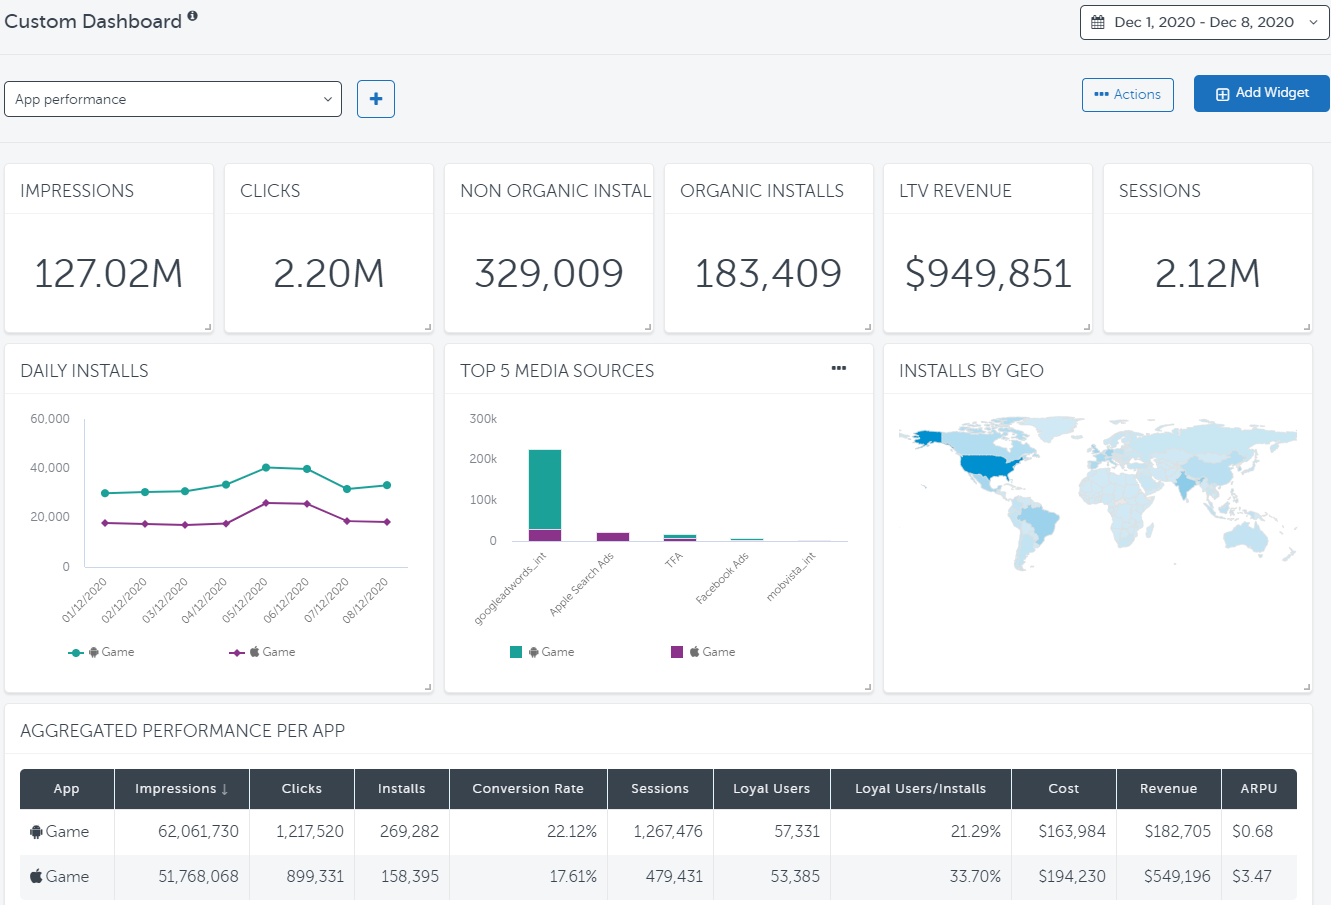
2. AppsFlyer
Best For: Marketers and app developers who need advanced mobile attribution, in-app analytics, and partner integrations to optimize campaigns across multiple channels.
Pricing:
Zero (Free) - Entry-level plan with core analytics and basic tools for organic growth. Ideal for apps looking to track initial installs and user activity without complexity. (Not suited for paid campaigns.)
Growth & Enterprise - Paid plans with advanced attribution, fraud protection, and premium features.
Both Zero and Growth users get a one-time bonus of 12K free conversion measurements and 30-day access to add-ons.
Reviews: 4.5/5.0 on Capterra
Ease of Use (UX/UI): AppsFlyer’s dashboard is praised for its intuitive design and real-time reporting. Users note that setup is straightforward, with step-by-step guides that make data pulling easier even for marketers without technical expertise. While some report a learning curve due to the platform’s depth, most agree the powerful insights are worth the effort.
Customer Support: Customer support is consistently highlighted as responsive and helpful. Many reviewers point out that AppsFlyer’s support team provides strong guidance during onboarding and integration, with dedicated resources available through its documentation and account managers.
Appsflyer Features:
Mobile Attribution: Track installs and measure campaign performance with detailed user behavior and in-app event data.
Custom Audiences: Create and sync tailored audience segments across ad networks for better targeting.
Deep Linking & Deferred Deep Linking: Ensures users land on the right in-app content whether the app is already installed or not.
Fraud Protection (Protect360): Detect and prevent invalid traffic to safeguard marketing budgets.
Real-Time Analytics: Access customizable dashboards with instant insights for data-driven decisions.
Partner Integrations: Connect with hundreds of ad networks and marketing platforms for smoother data sharing.
AppsFlyers Pros and Cons:
Pros
Cons
Intuitive UI: Easy setup with guides, even for non-technical marketers
Add-On Costs: Some advanced features (like Protect360) require separate purchase
Real-Time Reporting: Accurate insights for campaign optimization
Visualization Limits: Dashboards could better show web-to-app performance
Seamless Integrations: Works smoothly with partners and APIs
Learning Curve: Depth of data can feel overwhelming initially
Our Insights:
Businesses choose AppsFlyer when precision matters in mobile marketing expansion. Its OneLink deep linking, extensive partner integrations, and fraud prevention capabilities set it apart for app-first companies. While the advanced add-ons come at an additional cost, the accuracy of attribution and the depth of insights make AppsFlyer a valuable investment for growth marketers serious about mobile performance.
3. Google Analytics
Best For: Brands and agencies of all sizes that need a comprehensive, web-focused analytics tool to track website traffic, user behavior, and conversion performance. Particularly strong for marketers looking to understand the full customer journey across channels.
Pricing:
Free Version – Ideal for most small to mid-sized businesses, with robust website and conversion tracking features.
Google Analytics 360 (GA360) – Enterprise-level solution starting at $50,000 annually (can scale up to $150,000+ depending on data volume and requirements). GA360 offers advanced features like unsampled reports, BigQuery integration, and dedicated support.
Reviews: 4.5 / 5.0 (G2)
Ease of Use (UX/UI): Google Analytics is feature-rich, but its depth can make it less intuitive for beginners. The latest GA4 version improves navigation with event-based tracking and cross-platform reporting, though onboarding and customization require time and expertise.
Customer Support: Support quality depends on the plan. Free users rely on Google’s Help Center, community forums, and online documentation, while GA360 customers receive dedicated account management, SLAs, and premium support channels.
Google Analytics Features:
Event-Based Tracking (GA4): Monitor every interaction on your website or app, from clicks to scroll depth, giving a more complete picture of user behavior.
Cross-Platform Reporting: Unify data from web and mobile apps to understand the customer journey across devices.
Attribution Modeling: Compare different attribution models (first click, last click, data-driven) to better evaluate campaign performance.
Audience Segmentation: Build custom segments based on demographics, behavior, and acquisition channels to identify high-value customers.
Funnel & Path Analysis: Visualize drop-offs in the conversion journey and analyze how users navigate your site or app.
Integration with Google Ecosystem: Seamless connections with Google Ads, BigQuery, and Search Console to optimize paid campaigns and organic performance.
Real-Time Analytics: See live data on active users, top-performing pages, and conversions as they happen.
Google Analytics Pros and Cons
Pros
Cons
Customer-Centric Measurement: Provides a holistic view of how users interact across websites, apps, and connected systems (like CRM or POS).
Customization Complexity: Setting up advanced funnels, events, and API integrations can be resource-intensive.
Predictive Insights with Machine Learning: Identifies trends such as purchase likelihood or churn risk to optimize marketing spend.
Steep Learning Curve: GA4’s event-based model requires significant setup and training, especially for teams migrating from Universal Analytics.
Seamless Google Ecosystem Integration: Directly connects with Google Ads, Search Ads 360, Display & Video 360, and Search Console.
Limited Support for Free Users: Most users rely on help forums and documentation unless on GA360.
Global Infrastructure & Security: Ensures data accuracy, reliability, and compliance at scale.
High Cost for Enterprise: GA360 pricing ($50K–$150K+) may be prohibitive for smaller businesses.
Our Insights
Google Analytics remains the go-to standard for digital performance measurement, especially for marketers who want to connect web, app, and advertising data in one ecosystem. Its machine learning capabilities make it more than just a reporting tool — helping growth marketers predict outcomes like churn and conversion likelihood.
While the platform can feel overwhelming at first, especially with GA4’s event-based setup, its ability to tie customer interactions directly to marketing ROI makes it indispensable for D2C brands and agencies aiming to maximize efficiency across channels.
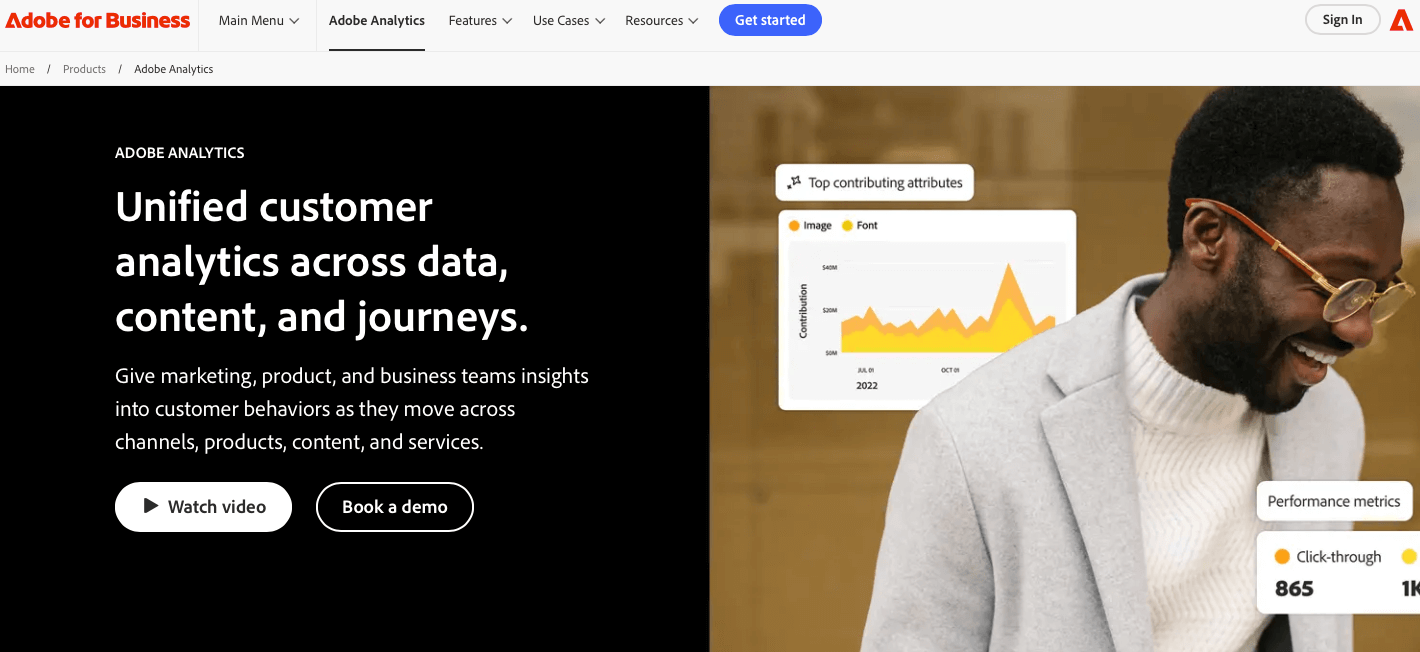
4. Adobe Analytics
Best For: Large enterprises and data-driven organizations that need advanced, customizable analytics across multiple channels and touchpoints. Ideal for marketing leaders and agencies managing complex customer journeys at scale.
Pricing: Adobe Analytics does not publish official pricing. Costs are customized based on data volume, features, integrations, and the number of users. According to our research:
Small to mid-sized businesses may pay around $2,000–$2,500/month.
Large enterprises can spend $100,000+ annually depending on scale and requirements.
Reviews: 4.1 / 5.0 (G2)
Ease of Use (UX/UI): Adobe Analytics is known for its robust and customizable dashboards, but it’s not the most beginner-friendly platform. Many users highlight its complexity, which requires training or dedicated analysts to unlock its full potential.
Customer Support: Support is generally strong for enterprise clients, with access to dedicated account managers, onboarding, and technical support. However, some users report slower response times and reliance on technical expertise to resolve complex issues.
Adobe Analytics Features
Customer Journey Insights: Connect customer identity with interactions across channels, devices, and time to visualize complete B2C and B2B journeys.
Flexible Data Frameworks: Purpose-built to ingest and process diverse customer and account data types, delivering insights in minutes rather than weeks.
Generative AI for Analysis: Accelerates everyday tasks like anomaly detection, segmentation, and optimization across billions of data points.
Digital Analytics for Web & Mobile: Collect and analyze real-time behavioral data across digital properties to optimize marketing strategies and improve user experiences.
Product & Growth Analytics: Equip product and marketing teams with insights into user preferences, friction points, and retention opportunities to enhance customer experience.
Content Analytics: Evaluate creative asset performance at a granular level (e.g., color, background, emotion, keywords) to optimize engagement and ROI.
Cross-Application Integration: Seamlessly share data, segments, and insights across Adobe’s suite (Real-Time CDP, Journey Optimizer, etc.) and other business applications.
Adobe Analytics Pros and Cons
Pros
Cons
AI & Machine Learning Support: Generative AI speeds up segmentation, anomaly detection, and predictive insights.
High Cost: Pricing can reach $100K+ annually for enterprises, making it less accessible for smaller businesses.
Flexible Data Frameworks: Handles large-scale, complex data types and delivers insights faster than traditional analytics setups.
Overkill for Smaller Teams: The scale and feature set are often more than what SMBs need.
Content & Product Analytics: Provides granular insights into asset performance and product journeys for optimization.
Complex Setup & Maintenance: Initial configuration and ongoing data management often require technical expertise.
Deep Customer Journey Insights: Tracks users across channels, devices, and time for a unified view of B2C and B2B journeys.
Support Variability: While enterprise clients get strong support, some users report slower response times.
Our Insights
Adobe Analytics is a powerhouse for enterprise-level marketers who need to connect every customer touchpoint into a single, actionable view. Its AI-driven insights and ability to handle massive, complex datasets make it particularly valuable for brands managing omnichannel customer journeys or high-volume digital experiences.
While it requires significant resources and expertise to implement, Adobe’s ability to deliver contextual, real-time, and predictive analytics across customer, product, and content data makes it one of the most advanced tools available — best suited for large organizations that can fully utilize its capabilities.
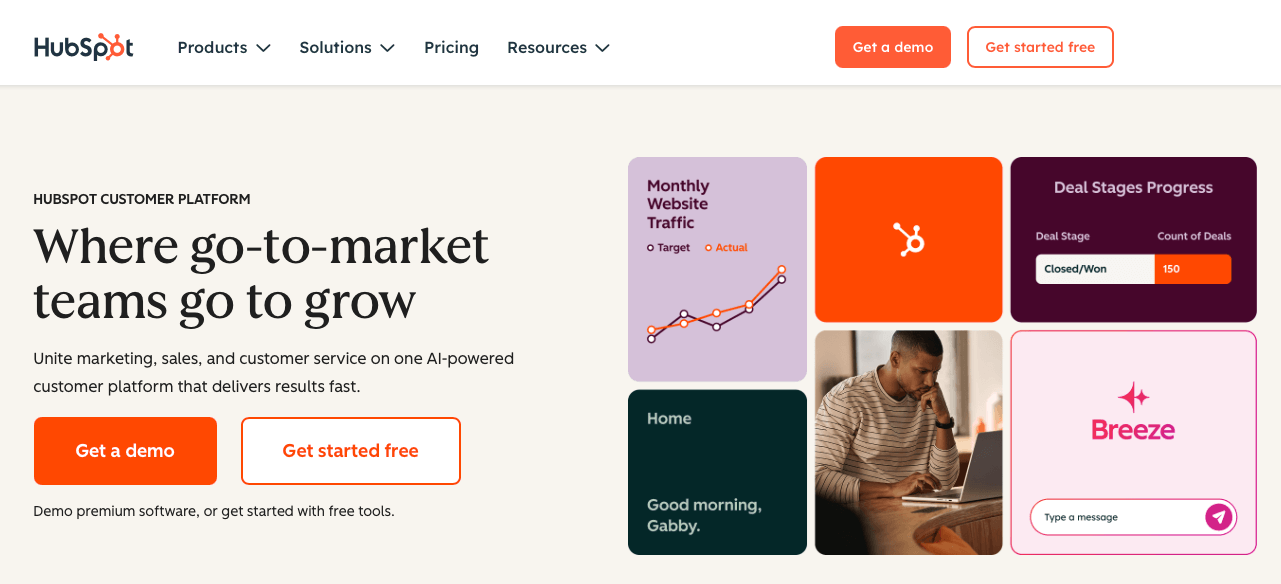
5. Hubspot
Best For: Growing D2C brands, agencies, and marketing teams looking for an all-in-one CRM and analytics platform that combines customer data, campaign performance tracking, and automation. HubSpot is especially useful for teams wanting both marketing execution and analytics under one roof.
Pricing:
HubSpot offers a wide range of pricing tiers to fit different needs:
Free Tools – Basic analytics and CRM features suitable for individuals or small teams.
Marketing Hub Starter – Starts at $9/month per seat.
Starter Customer Platform – Starts at $9/month per seat.
Marketing Hub Professional – Starts at $800/month (includes 3 core seats).
Ease of Use (UX/UI): HubSpot is known for its user-friendly design and streamlined workflows. Its dashboards are customizable, making analytics accessible to both technical and non-technical users.
Customer Support: HubSpot provides 24/7 customer support via phone, email, and chat, along with a vast knowledge base, HubSpot Academy courses, and community forums. Higher-tier plans include dedicated account managers and strategic guidance.
HubSpot Analytics Features
Unified Marketing Dashboards: Measure campaign performance across all channels — from emails and ads to blog posts and social — in one centralized HubSpot reporting dashboard.
Top-Performing Asset Identification: Track which marketing assets drive the most engagement and conversions across the customer journey.
Website Performance Analytics: Monitor traffic volume, session quality, page performance, and conversion rates to optimize site experience.
Customer Lifecycle Tracking: Connect marketing interactions to closed revenue by analyzing CRM data and mapping the full customer journey.
Multi-Touch Revenue Attribution: Understand how different marketing touchpoints work together to drive pipeline and revenue.
Detailed Marketing Reports: Generate reports for every asset (website, social posts, ads, emails) and add them to customizable dashboards for ongoing monitoring.
Behavioral Tracking with HubSpot Code: Use HubSpot’s tracking code to monitor visitor actions, trigger automation workflows, and gain deeper insight into user behavior.
HubSpot Analytics Pros and Cons
Pros
Cons
All-in-One Platform & User-Friendly UI: Users consistently praise the intuitive interface and seamless integration with HubSpot CRM and other tools
Steep Pricing Curve: Many advanced features are locked behind higher-tier plans, making costs climb steeply as businesses grow.
Strong Support & Resources: Excellent customer service and training offerings, including HubSpot Academy and responsive support, help ease onboarding.
Feature Gaps in Lower Tiers: Basic plans may lack advanced customization or analytics features.
Recognition in the Market: Ranked #1 in Marketing & Digital Advertising by G2 in 2024 and continues to receive top honors, reflecting high user satisfaction.
Load Time & Learning Curve: Handling large datasets can slow load times, and some advanced automation features require a bit of a learning curve despite available resources.
Reliable Dashboarding & Automation: Dashboards are clear and customizable, automation saves time, and reporting is robust.
Customization Constraints: Some review feedback notes limited report customization and design flexibility unless you're on higher-tier plans or involve third parties.
Our Insights
HubSpot Marketing Hub stands out as a comprehensive analytics and automation platform that is notably accessible for both marketers and non-technical stakeholders. Its dashboards, CRM integration, and automation workflows let teams easily track and visualize marketing performance—all from a single hub.
However, as budgets scale or teams require more advanced analytics, the costs can rise quickly, and bulky datasets may affect responsiveness. Despite this, HubSpot’s rich learning ecosystem, strong support, and market recognition make it a compelling choice for brands and agencies that value centralized control and clarity over their marketing efforts.
6. Woopra
Best For: Growth marketers and customer experience teams that need real-time customer journey analytics across web, product, sales, and support touchpoints. Ideal for SaaS companies and D2C brands that want to analyze retention, churn, and customer lifecycle behaviors in detail.
Pricing: Woopra offers four pricing tiers:
Free – Basic analytics with limited tracking.
Startup – $49/month, designed for small teams needing advanced analytics beyond the free version.
Pro – $999/month, includes a full suite of features for larger organizations requiring in-depth tracking and automation.
Enterprise – Custom pricing tailored to scale, integrations, and feature requirements.
Reviews: 4.3 / 5.0 (Capterra)
Ease of Use (UX/UI): Woopra’s interface is considered modern and intuitive, making it relatively easy to navigate compared to more complex enterprise analytics platforms. Real-time dashboards and visual customer journey maps stand out as strong usability features.
Customer Support: Woopra provides email and live chat support, alongside an extensive knowledge base and documentation. Enterprise customers get dedicated account managers and custom onboarding. Some reviews note that while support is helpful, it can be slower for lower-tier plans.
Woopra Analytics Features
Customer Journey Visualization: Map every touchpoint across web, marketing, sales, and product to see how actions connect and influence customer experience.
Journey Reports: Combine user actions and attributes to reveal obstacles, opportunities, and drop-off points in the customer lifecycle.
Trends Reports: Track how key metrics (like product usage, campaign performance, or subscription changes) evolve over time to uncover growth drivers.
Cohort Reports: Compare performance across user groups (e.g., by signup date or acquisition source) to identify patterns in retention and engagement.
Retention Reports: Measure how long customers keep engaging post-signup or purchase, and flag at-risk users for proactive retention strategies.
Behavioral Segmentation: Create dynamic user segments based on behaviors (emails opened, trial sign-ups, purchases, feature usage) for highly targeted analysis.
Real-Time Insights: Update dashboards instantly as users interact with your site or product, enabling immediate optimization decisions.
Woopra Analytics Pros and Cons
Pros
Cons
Comprehensive Customer Journey Mapping: Visualizes every touchpoint, making it easier to see how users move from acquisition to retention.
Integration Limitations: Some reviews note fewer native integrations compared to larger platforms, requiring workarounds.
Real-Time Analytics: Dashboards update instantly, giving growth teams immediate visibility into customer behavior.
Support Variability: Lower-tier users report slower response times compared to enterprise clients with dedicated managers.
Steep Learning Curve for Complex Reports: While the interface is intuitive, advanced segmentation and reporting may overwhelm non-technical users.
Our Insights
Woopra stands out as a customer journey analytics specialist—making it particularly useful for SaaS and D2C brands focused on retention, churn reduction, and lifecycle optimization. Its mix of real-time dashboards, cohort tracking, and retention reports gives teams a full picture of customer health, not just acquisition. For marketers who want to go beyond traffic numbers and see how customers truly engage over time, Woopra is a solid option.
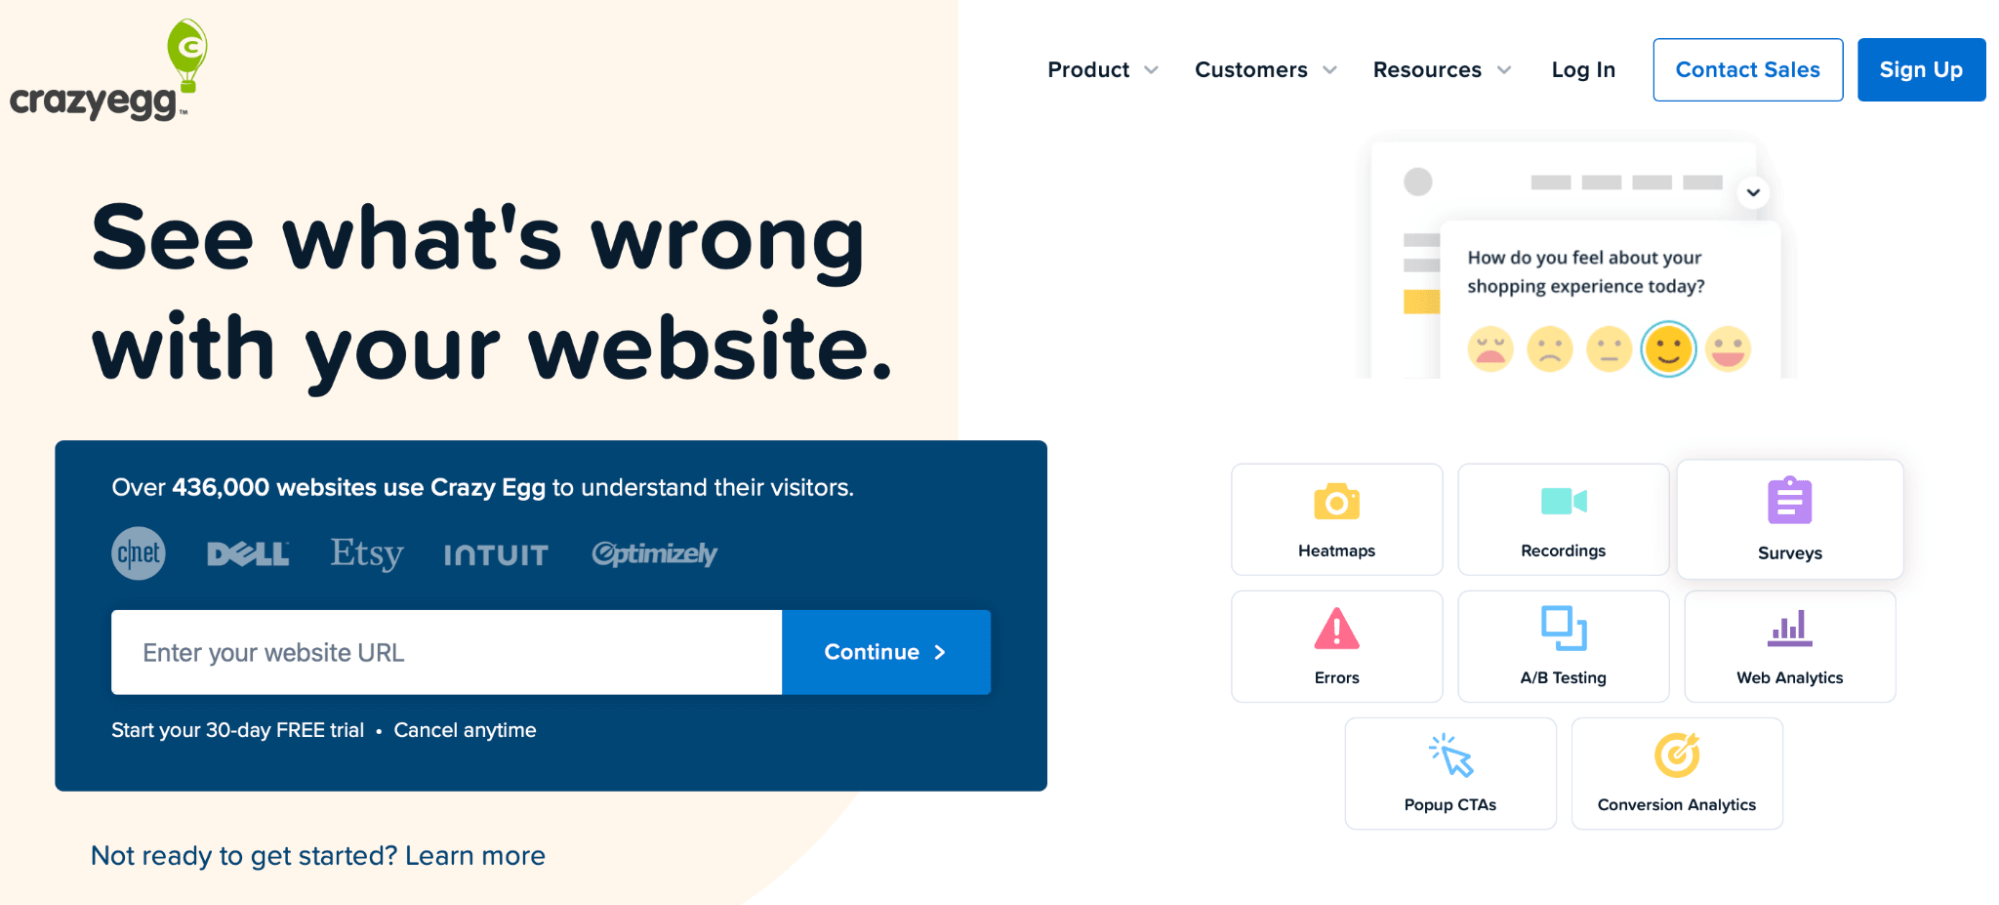
7. Crazy Egg
Best For: Marketers, UX designers, and eCommerce teams who want visual analytics like heatmaps, scroll maps, and A/B testing to optimize website design, conversions, and user experience.
Pricing: Crazy Egg offers four main plans:
Starter – $29/month
Plus – $99/month
Pro – $249/month
Enterprise – $499/month
All plans include unlimited web analytics, heatmaps, website domains and surveys and responses.
Reviews: 4.4 / 5.0 (Capterra)
Ease of Use (UX/UI): Crazy Egg is considered highly intuitive and beginner-friendly, with drag-and-drop A/B test setup and clear visual reporting. Marketers often highlight that insights are accessible without technical expertise.
Customer Support: The platform provides email and chat support, as well as a knowledge base with guides and tutorials. While most users find support responsive, some note that advanced troubleshooting can take longer for complex A/B testing setups.Yes
Crazy Egg Analytics Features
Visual Heatmaps & Scroll Maps: Quickly see where visitors click, scroll, and interact most on your site to identify high-performing areas and weak spots.
One Essential Dashboard: Monitor key traffic metrics at a glance, without complex setup or endless configuration.
Conversion Tracking & Reporting: Define conversion triggers (forms, buttons, pages) and track them side-by-side to see which elements drive the most value.
Segmentation Analysis: Break down user behavior across different dimensions (device, location, source) in simplified reports that are easy to digest.
Session Recordings & Error Tracking: Replay visitor sessions to uncover friction points and watch where JavaScript errors cause drop-offs, complete with detailed error logs.
A/B Testing Made Simple: Launch unlimited split tests directly in Crazy Egg’s interface to test changes and optimize conversion performance.
Clean, Simplified KPIs: Get clear metrics like conversion count, conversion value, and visitors converting — presented in both table and chart formats without extra setup.
Crazy Egg Analytics Pros and Cons
Pros
Cons
Visual Analytics: Heatmaps, scroll maps, and recordings make it easy to see how visitors interact without needing technical expertise.
Traffic Volume Limits: Higher traffic websites may need to upgrade quickly to more expensive tiers.
Simple Conversion Reporting: Out-of-the-box dashboards make it easy to track conversions and ROI without complex setup.
Limited Integrations: Fewer direct integrations compared to more comprehensive analytics suites.
User-Friendly A/B Testing: Intuitive split testing allows teams to optimize pages without coding knowledge.
Support Response Times: While generally helpful, some users note slower support for technical issues on lower-tier plans.
Error Tracking with Session Replay: Quickly identify and resolve JavaScript errors by watching actual visitor sessions.
Limited Depth Compared to Enterprise Tools: Doesn’t offer advanced attribution modeling or cross-channel analytics like GA or Adobe Analytics.
Our Insights
Crazy Egg is an excellent choice for marketers and UX teams who need visual, conversion-focused analytics without the complexity of enterprise platforms. Its heatmaps, recordings, and simple dashboards provide actionable insights quickly — helping teams identify friction points, optimize user flows, and increase ROI.
While it lacks the depth of tools like Google Analytics or Adobe Analytics, Crazy Egg shines for ease of use, affordability, and conversion-centric reporting, making it a strong fit for SMBs and mid-market D2C brands aiming to improve website performance.
8. Ahrefs
Best For: Marketers, SEO specialists, and content teams looking for comprehensive SEO and backlink analytics. Ideal for D2C brands, agencies, and growth marketers who want to improve organic visibility, track keyword performance, and analyze competitors.
Pricing: Ahrefs offers tiered plans depending on usage and features:
Lite – $129/month
Standard – $249/month
Advanced – $449/month
Reviews: 4.5 / 5.0 (G2)
Ease of Use (UX/UI): Ahrefs is considered straightforward and well-organized, with dashboards that make SEO data easy to interpret even for non-technical users. However, its depth means new users may face a learning curve before mastering advanced reports.
Customer Support: Ahrefs provides email and live chat support, plus a comprehensive knowledge base, blog, and training resources. Reviews often highlight that while support is responsive, it could be more personalized compared to enterprise-focused platforms.
Ahrefs Analytics Features
Comprehensive Dashboard: Track SEO performance across multiple projects and monitor keyword rankings, backlinks, and traffic trends in one place.
Portfolios: Monitor the performance of multiple URLs or domains at once — ideal for agencies managing several clients or brands running multiple sites.
Report Builder: Create customized reports to measure the impact of SEO efforts and demonstrate ROI to stakeholders.
Site Audit: Run in-depth audits to identify technical issues, track improvements, and optimize website health for better search performance.
Web Analytics: Gain insights into website traffic sources, engagement metrics, and keyword-driven performance.
Content Explorer: Discover trending content, track brand mentions, and find new link-building opportunities for growth.
AI Content Helper: Use AI-powered recommendations to improve existing content, optimize for search intent, and enhance keyword targeting.
Ahrefs Analytics Pros and Cons
Pros
Cons
Massive Backlink Index: One of the largest and most accurate backlink databases, making it a top tool for competitive link analysis.
Learning Curve for New Users: The platform’s depth means it can feel overwhelming for beginners without SEO experience.
All-in-One SEO Platform: Combines site audits, keyword tracking, content research, and competitor analysis in a single tool.
No Native Paid Media Tracking: Focuses solely on organic performance — not ideal for teams wanting a single view of paid + organic.
Content Explorer: Excellent for discovering trending topics, monitoring mentions, and identifying link-building opportunities.
Restricted Seats per Plan: Lower-tier plans have strict seat limits, which can be challenging for larger teams.
Custom Reporting Tools: Built-in report builder makes it easier to showcase SEO impact and ROI to clients or stakeholders.
Limited Integrations: Compared to broader analytics tools, Ahrefs offers fewer direct integrations with external marketing platforms.
Our Insights
Ahrefs is widely regarded as one of the most powerful SEO analytics platforms on the market, with unmatched backlink data and keyword research tools. It excels at helping growth marketers and agencies identify opportunities for organic growth, monitor competitors, and demonstrate ROI through clear reporting.
Ahrefs delivers exceptional value for teams where SEO and content marketing are key growth drivers. Its combination of technical audits, keyword tracking, and content insights make it indispensable for brands serious about scaling their search visibility.
9. Domo
Best For: Mid-size to enterprise organizations—especially marketing and analytics teams—looking for a comprehensive, scalable cloud BI platform that unifies data integration, dashboards, automation, and AI-powered insights.
Pricing: Domo provides a free trial but doesn’t list fixed pricing publicly. Based on our research and industry reports:
Mid-sized businesses can expect annual costs between $20,000 – $50,000, with some sources citing a broader range of $20,000 – $100,000+ depending on usage and scale.
Large enterprises often pay $100,000 or more annually, influenced by data volume, users, connectors, and advanced features
Reviews: 4.3 / 5.0 (G2)
Ease of Use (UX/UI): Users consistently praise Domo’s intuitive dashboard creation, mobile-friendly design, and ease of onboarding—even for complex BI needs.
Customer Support: Customers note Domo offers top-tier support, with responsive teams that prioritize issue resolution. However, some feedback suggests support can be slower for complex or lower-tier issues
Domo Analytics Features
Full BI Platform in One: Offers drag-and-drop ETL, dashboards, low-code app builders, embedded analytics, and automated reporting—all in a unified cloud platform.
Extensive Connector Library: Access to hundreds of pre-built connectors for data sources across cloud services, CRMs, warehouses, and legacy systems.
AI-Powered Analytics (Domo AI): Includes predictive modeling, AI chat, automated alerts, and custom AI agents for smarter analysis.
No-Code Workflows & Automation: Enables action-based workflows, alerts, and reporting automation without coding.
Mobile-Optimized Experience: Fully executable dashboards and analytics on mobile with real-time interactivity and formatting for mobile users.
Credit-Based Pricing Model: Usage is tied to a credits system, where data queries, dashboards, and integrations consume credits, helping manage costs (though it requires monitoring to avoid surprises).
Embedded ETL (Magic ETL): Simplifies data processing and transformation with visual tools, easing data preparation for analysis
Domo Analytics Pros and Cons
Pros
Cons
Ease of Use & Mobile Support: Intuitive interface, easy dashboard creation, and strong mobile usability.
Opaque & High Pricing: Cost depends on credit usage, connectors, and scale—making budgeting unclear for new users.
Strong Customer Support: Many users cite responsive, high-quality service and quick issue resolution.
Connector Friction: Some users report certain connectors require setup help or can be unreliable.
Advanced Analytics & AI: Offers built-in intelligent automation and AI-assisted insights for smarter decision-making.
Performance & Load Times: With large datasets, users may observe lag or dashboard slowdowns.
Scalable for Enterprises: Handles large-scale data transformation, visualization, and user access at scale.
Learning Curve: Custom setups and advanced workflows may require analytical or technical support under the hood.
Our Insights
Domo positions itself as a robust enterprise-grade BI and analytics platform—ideal for organizations that want to unify data operations, visualization, automation, and AI capabilities in a single ecosystem. Its intuitive dashboards and mobile functionality make it accessible to non-technical users, while its credit-based model and enterprise scalability appeal to data-heavy teams.
That said, the lack of transparent pricing and complex usage-based billing require diligence to manage costs, and some advanced implementations may still demand technical oversight. For growth-focused marketers looking to sync insights from across systems and empower accessible analytics across teams, Domo is an extremely powerful (albeit premium) option.
10. HockeyStack
Best For: B2B SaaS companies and revenue-focused marketing teams that want end-to-end analytics for the entire customer journey. HockeyStack is designed to connect marketing, sales, and revenue data without requiring engineering support.
Pricing: HockeyStack does not publicly disclose pricing. Based on user reports, the Starter plan is typically around $2,000/month, with higher tiers scaling up significantly depending on data volume, integrations, and features. Pricing is largely tailored to company needs.
Reviews: 4.6 / 5.0 (G2)
Ease of Use (UX/UI): HockeyStack is known for its clean, intuitive dashboard and straightforward setup. Unlike many analytics tools, it doesn’t require complex engineering work or coding knowledge, making it accessible for non-technical marketing and growth teams.
Customer Support: The platform is well-regarded for hands-on support, with users citing responsive communication and proactive onboarding. Many reviewers emphasize that the team is open to feedback and often incorporates feature requests quickly.
HockeyStack Analytics Features
Full-Funnel Revenue Analytics: Connects marketing, product, and sales data to show how every touchpoint contributes to pipeline and revenue.
Customer Journey Mapping: Visualize the entire journey from first touch to closed deal, helping teams understand which campaigns drive conversions.
Multi-Touch Attribution Models: Attribute revenue across channels and campaigns using customizable models that go beyond first- or last-touch.
No-Code Setup: Collect and connect data without engineering resources, making it accessible to marketing and growth teams.
Custom Dashboards & Reports: Build dashboards that combine marketing, product usage, and revenue metrics in one view.
Churn & Retention Analytics: Track product usage patterns to identify churn risks and discover behaviors that correlate with long-term retention.
Account-Based Analytics: Designed for B2B, with insights at the account and individual level to measure buying committee engagement and pipeline influence.
HockeyStack Analytics Pros and Cons
Pros
Cons
Revenue-Focused Analytics: Ties every marketing and product touchpoint directly to pipeline and closed revenue.
Still a Growing Platform: Some reviewers note feature requests are still being built out compared to older, more mature analytics tools.
No-Code Setup: Doesn’t require engineering resources, making it easy for marketers to implement and maintain.
Limited Public Pricing Transparency: Costs are not disclosed upfront, requiring conversations with sales for exact quotes.
Custom Dashboards: Flexible reporting that combines product, marketing, and sales data in one view.
B2B Focused: Tailored heavily for SaaS and B2B teams; less relevant for eCommerce or consumer-first businesses.
Multi-Touch Attribution Models: Helps marketers accurately distribute credit across campaigns.
Learning Curve for Advanced Reporting: While easy to set up, creating more complex reports can take time to master.
Our Insights
HockeyStack is built for B2B teams that need to tie marketing directly to revenue, making it a standout option for SaaS marketers and growth leaders. Unlike traditional web analytics, it provides full-funnel visibility, showing exactly which campaigns and touchpoints influence pipeline and customer retention.
Its no-code approach and strong customer support make it accessible even for teams without data engineers. However, the higher starting price and niche B2B focus mean it’s best suited for companies where customer journey analytics and revenue attribution are mission-critical.
11. Mixpanel
Best For: Product, growth, and marketing teams that want deep product analytics to understand user behavior, track retention, and optimize engagement across web and mobile apps. Ideal for SaaS, mobile-first companies, and consumer apps.
Pricing: Mixpanel offers three main plans:
Free – Includes core analytics for up to 20M events per month.
Growth – Flexible, starts at $0/month, with costs scaling based on monthly event volume and additional features.
Enterprise – Custom pricing for organizations with advanced needs like data governance, enterprise security, and dedicated support.
Reviews: 4.5 / 5.0 (G2)
Ease of Use (UX/UI): Mixpanel is considered clean and modern, with intuitive dashboards and drag-and-drop report creation. However, reviews point out that advanced features (like custom event tracking) can require technical setup and familiarity with event-based analytics.
Customer Support: Mixpanel provides chat and email support, a comprehensive knowledge base, and community forums. Higher-tier plans include dedicated support and customer success managers. Users generally find support responsive, but some note that response times can vary for complex technical issues.
Mixpanel Analytics Features
Product Analytics (self-serve, real-time): Understand user behavior, engagement, and growth with event-based analysis designed for product teams to answer questions fast.
Web Analytics (from first click to purchase): See where users drop off, optimize campaigns, and connect website behavior to outcomes; Mixpanel also stitches anonymous and logged-in activity for full-journey views.
Mobile Analytics (install → loyal user): Track in-app actions, find friction points, and improve retention across iOS/Android with analytics built for mobile experiences.
Warehouse Connectors (use “the interface you love” on trusted data): Bring CRM, marketing, and purchase data from Snowflake, BigQuery, Databricks, or Redshift into Mixpanel for unified analysis (available as an add-on/enterprise capability).
Funnels & Retention (core reports): Analyze drop-offs across steps and measure engagement over time with built-in funnels and retention reports.
Account/Group Analytics (B2B): Roll up behavior at the account level to understand adoption and churn risk across buying teams.
Mixpanel Analytics Pros and Cons
Pros
Cons
Actionable Product Analytics: Built specifically for understanding user behavior across web, mobile, and product touchpoints.
Event-Based Setup Required: Requires teams to define and implement events upfront, which can be time-intensive without engineering help.
Clear Web & Mobile Insights: Helps pinpoint drop-offs from first click to purchase and tracks mobile engagement through installs, sessions, and retention.
Pricing Transparency: Free and Growth tiers are flexible, but costs for larger event volumes and Enterprise features are not publicly disclosed.
Good Customer Support: Responsive chat and email support plus knowledge base; Enterprise customers get dedicated success managers.
Data Limits on Free Plan: High-volume teams will need to upgrade quickly as event caps are reached.
Warehouse Connectors: Ability to use Mixpanel’s interface on trusted backend data sources (Snowflake, BigQuery, Databricks, etc.) for unified reporting.
Learning Curve for Advanced Reports: While the UI is clean, advanced funnels, retention, or cohort analyses can overwhelm non-technical users.
Our Insights
Mixpanel excels as a product-first analytics platform for growth teams that want to go beyond vanity metrics and understand the “why” behind user behavior. Its ability to track the full digital experience—from website clicks to in-app engagement—makes it invaluable for SaaS, mobile apps, and consumer products. The addition of warehouse connectors strengthens its role as a trusted analytics layer across broader data ecosystems.
Mixpanel remains a favorite for teams that prioritize retention, engagement, and actionable product insights over purely marketing-centric reporting.
Final Thoughts on Analytics Tools
Choosing the right analytics tool comes down to your team’s goals, scale, and the type of data that drives your growth. Whether it’s a platform like Google Analytics for web performance, Ahrefs for SEO, or Domo for enterprise-wide BI, the key is finding a solution that not only collects data but also turns it into actionable insights.
As analytics needs grow within an organization, it’s worth treating data analytics as a core hard skill. Training through structured learning or a data analytics certification can help teams get more value from these insights.
For brands investing heavily in influencer and affiliate marketing, Influencer Hero stands out as a powerful option. Unlike generalist tools, it combines end-to-end influencer campaign management with advanced analytics—helping you directly connect creator performance to revenue.
Ready to see how Influencer Hero can help you scale smarter with actionable analytics? Book a demo today and start driving growth with clarity.
What criteria should growth-focused marketers look for in analytics tools?
Focus on tools that offer cross-channel visibility, strong attribution and ROI tracking, user-friendly dashboards, robust integrations, and behavioral or cohort analysis. They should scale with your needs and include features like real-time alerts or niche functionalities (e.g., influencer-specific analytics). These capabilities help you unify data and glean actionable insights across all marketing touchpoints.
Which analytics tools are the best for tracking influencer marketing ROI?
For influencer-first strategies, tools like Influencer Hero stand out because they provide deep, direct analytics on influencer campaigns—including conversions, ROI per creator, real-time dashboards, and campaign-specific performance. General tools may lack these influencer-specific insights and attribution models.
Are there free analytics tools that are good for growth marketers?
Yes—Google Analytics (standard version) and Mixpanel Free Plan offer powerful entry points. Google Analytics delivers robust web and event tracking, while Mixpanel's free tier includes up to 20M monthly events for product behavior insights. However, both have usage caps. For full enterprise features or extended data capacity, paid plans are necessary.
How do I choose between general analytics tools and niche tools
Start with a general tool for broad visibility—like Google Analytics, HubSpot, or Mixpanel—that covers traffic, funnels, and basic attribution. If your focus is specific—like SEO, content performance, retention, or influencer campaigns—layer in niche tools such as Ahrefs (SEO), Crazy Egg (UX heatmaps), Woopra (journey analytics), or HockeyStack (revenue attribution for SaaS/B2B). This hybrid approach ensures both breadth and depth.
How can growth marketers accurately measure attribution across multiple channels?
Use analytics platforms that offer multi-touch attribution models, or integrate data from all channels into a centralized BI platform like Domo or via a marketing dashboard tool like AgencyAnalytics or Improvado. These let you map influence across touchpoints (ads, email, organic, influencer) and correlate spend and impact. Verify that the tool supports granular reporting, modeling flexibility, and cross-channel datasets.


.png)