Influencer marketing has become a powerful channel for driving sales, building brand awareness, boosting website traffic, increasing social media engagement, and fostering customer retention and loyalty. But without proper tracking, brands risk investing heavily in creator collaborations with little insight into what’s truly delivering results.
ROI (Return on Investment) is a key metric in influencer marketing, measuring the value a brand gains from an influencer campaign compared to the amount spent.
So, how do you track influencer marketing ROI? By following these seven steps:
Define Your Campaign Goal: Clarify whether you're aiming for sales, traffic, engagement, awareness, or retention.
Set Key Performance Indicators (KPIs): Define what you’ll measure. Choose metrics that directly align with your campaign goal.
Track Costs Accurately: Include all campaign-related expenses.
Set Up Tracking Tools: Use tools like UTM links, affiliate and influencer marketing platforms, and analytics to track performance effectively.
Calculate Influencer Marketing ROI: Apply formulas based on your campaign objective.
Calculate ROI for Each Influencer: Assess which creators delivered the best performance relative to cost.
Create Reports, Benchmark Results, and Optimize Future Campaigns: Summarize results, compare against past campaigns or industry benchmarks, and apply insights to improve future efforts.
Whether you're partnering with nano, micro, macro, or celebrity influencers on platforms like Instagram, TikTok, or YouTube, tracking ROI is essential to determine cost-effectiveness, optimize budgets, prove campaign impact to stakeholders and leadership, refine content strategy and influencer selection, and improve performance over time.
In this guide, we’ll walk you through:
What influencer marketing ROI is
Why it matters for brands and marketers
How to track it for different campaign goals using measurable KPIs
A real-life example of influencer marketing ROI in action
What is Influencer Marketing ROI?
Influencer Marketing ROI (Return on Investment) refers to the measurable value (return) a brand gains from an influencer campaign compared to the cost (investment).
In simple terms, it answers the question: "Was this influencer campaign worth the investment?". It shows whether the campaign was profitable, cost-effective, and potentially scalable.
What Counts As “Return” And “Investment”?
Return refers to the results or value generated by the campaign, and it varies depending on the campaign goal:
Sales-focused campaigns: Revenue, conversions, average order value
Awareness campaigns: Impressions, reach, mentions, new followers
Traffic campaigns: Clicks, time on site, bounce rate
Retention and loyalty campaigns: Repeat purchases, referrals, customer lifetime value (CLV)
Investment is the total cost of running the campaign and may include:
Influencer fees (flat rate, commission, bonuses)
Gifted products (retail value + shipping)
Agency, platform, or tools fees
Paid media (boosted posts, ads)
Internal time and resources spent managing the campaign
Because influencer marketing can impact multiple stages of the customer journey—from discovery to loyalty—how you calculate ROI depends on your specific campaign objective.
Standard Formula to Calculate ROI
For sales-driven campaigns, the standard ROI formula is:
ROI (%) = [(Return – Investment) / Investment] × 100
Example: If you spend $3,000 on a campaign and generate $9,000 in revenue:
ROI = (9,000 – 3,000) / 3,000 × 100 = 200%
This means your campaign returned $3 for every $1 invested.
However, influencer marketing often delivers value beyond direct sales. For goals like brand awareness, engagement, website traffic, or customer loyalty, ROI should be measured using other relevant metrics, which we’ll cover in the next sections.
Why Tracking ROI in Influencer Marketing Matters
Tracking ROI in influencer marketing is essential to understanding the true impact of your campaigns. It helps ensure your efforts are driving meaningful results and that your budget is being spent wisely.
Here’s why it matters:
Justify Your Marketing Budget
Proving ROI shows that your influencer investment is delivering value. This helps you secure future budgets and confidently report results to stakeholders.
Identify Top-Performing Influencers
ROI data reveals which creators are actually driving results, allowing you to focus on high-performing partnerships and optimize resource allocation.
Align Influencer Content With Business Goals
When creators understand the campaign objectives, they can craft content that better supports those goals, leading to more effective and authentic collaborations.
Evaluate Success And Improve Strategy
ROI tracking allows you to analyze performance, benchmark results, and gather insights to strengthen future campaigns. By identifying what works (and what doesn’t), you can refine your targeting, messaging, content formats, and platform choices.
In short: Tracking ROI transforms influencer marketing from a “nice to have” into a strategic, results-driven growth channel.
How to Track Influencer Marketing ROI: Step by Step
Here’s a typical step-by-step process to help you measure success and make data-driven decisions:
Step 1: Define Your Campaign Goal
You can’t effectively track influencer marketing ROI without first defining what “return” means for your brand.
Start by asking: What do you want to achieve with this influencer campaign?
Influencer marketing goals typically fall into one of the following categories:
Conversions / Sales (Bottom of Funnel – BoFu): Drive measurable purchases, sign-ups, or other direct conversions tied to influencer promotions.
Website Traffic (Middle of Funnel – MoFu): Increase the number of visitors to your site, landing page, or product page through influencer content and links.
Brand Awareness (Top of Funnel – ToFu): Get your brand in front of as many relevant eyes as possible, improve recognition, and generate interest.
Engagement (Top/Middle of Funnel – ToFu/MoFu): Encourage likes, comments, shares, and saves to deepen relationships and boost visibility within social media platforms.
Customer Loyalty & Retention (Post-Purchase / Retention Stage): Strengthen relationships with existing customers by keeping your brand top-of-mind and reinforcing affinity through influencer endorsement.
Your campaign goal will determine which KPIs (Key Performance Indicators) you track—and ultimately how you calculate ROI.
Step 2: Set Key Performance Indicators (KPIs)
Once your goal is clear, choose metrics that align directly with it. Key Influencer Marketing KPIs based on the campaign goal:
Campaign Goals Table
Campaign Goal
Key KPIs
Conversions / Sales
- Revenue from campaign
- Number of conversions
- Conversion rate
- CPA / CAC
- AOV
- ROAS
- Post-campaign sales lift
Website Traffic
- Link clicks
- Click-through rate (CTR)
- Website sessions / unique visitors
- CPC / Cost per session
- Bounce rate
- Session duration
- Pages per session
Brand Awareness
- Impressions
- Reach
- CPM
- Video views
- Earned Media Value (EMV)
- Hashtag usage
- Mentions & tags
- Share of voice (SOV)
- Search volume
- Follower growth rate
- Sentiment analysis
Engagement
- Likes
- Comments
- Shares
- Saves
- Story replies / polls / stickers
- Video views
- Engagement rate
- Cost per engagement (CPE)
Customer Loyalty & Retention
- Customer Lifetime Value (CLV)
- Purchase frequency
- Retention time
- Repeat purchase rate
- Repeat purchases
- Churn rate
- Referrals
- Net Promoter Score (NPS)
- CLV:CAC ratio
Conversions/Sales Campaigns
Revenue: Total sales generated from influencer-driven purchases.
Number of Conversions: Total count of completed desired actions (e.g., purchases, sign-ups, downloads, promo code redemptions) from influencer-driven traffic.
Conversion Rate: Percentage of influencer-driven visitors who completed the desired action.
Cost Per Acquisition (CPA) or Customer Acquisition Cost (CAC): Average cost to acquire one new customer via influencer marketing — helps assess cost-effectiveness.
Average Order Value (AOV): Average purchase amount from influencer-driven sales — indicates how much each customer spends and helps evaluate the quality and size of purchases generated.
Return on Ad Spend (ROAS): Revenue earned per dollar spent on paid influencer content — evaluates how well, paid influencer ads perform compared to other paid channels.
Sales Growth (Post-Campaign Lift): Increase in sales after the campaign — sometimes users don’t convert immediately, but within some days. Using attribution windows (e.g., 7- or 30-day) to credit late conversions provides a truer ROI.
Website Traffic Campaigns
Track these metrics to measure the volume and quality of visitors driven to your website through influencer content:
Link Clicks: Total number of times users clicked on the influencer’s link.
Click-Through Rate (CTR): Percentage of people who clicked on the influencer’s link — indicates how engaging or persuasive the content and call-to-action were.
Website Sessions / Unique Visitors: Number of distinct visits to your website via influencer links — shows the actual reach and traffic volume.
Cost Per Click (CPC) or Cost Per Visit/Session: Average cost for each click or session generated — useful for evaluating efficiency and comparing ROI across influencer partners.
Bounce Rate: Percentage of visitors who leave without further action — a lower bounce rate generally indicates more relevant and engaging traffic driven by the influencer.
Average Session Duration or Time on Site: How long users from influencer links stay on your site — longer sessions often indicate higher interest or engagement, and better quality traffic.
Pages per Session: Average number of pages viewed during a single visit — a key indicator of how deeply users explore your site.
*Track these metrics to measure the direct revenue impact and cost-efficiency of your influencer campaign: : A session begins when a user visits your site and includes all interactions until they are inactive for 30 minutes. Returning after that window starts a new session.
Brand Awareness Campaigns
Track these metrics to measure how widely your influencer campaign reaches and builds visibility for your brand:
Impressions: Total number of times the content was displayed.
Reach: Number of unique users who saw the content — a more accurate measure of unique exposure than impressions.
CPM (Cost per 1,000 Impressions): Indicates cost-efficiency in awareness campaigns — lower CPM suggests more efficient spending.
Views: Total video views across formats like Stories, Reels, TikToks, and YouTube — connects exposure and interaction.
Earned Media Value (EMV): Estimates the dollar value of organic exposure from influencer content — helps compare it to paid media spend.
Branded Hashtag Usage: Number of times your campaign or brand hashtag was used — indicates community participation and organic amplification.
Mentions & Tags: Count of posts where your brand was mentioned or tagged — signals brand visibility and user engagement.
Share of Voice (SOV): Your brand’s share of total mentions compared to competitors — useful for competitive benchmarking.
Search Volume: Increases in searches for your brand or products (e.g., on Google or TikTok) — reflects consumer curiosity sparked by influencer content.
Follower Growth Rate: Increase in social media followers as a result of influencer exposure — shows growing audience interest.
Sentiment Analysis: Measures the tone of conversations around your brand (positive, neutral, negative) — helps you understand how influencer content affects brand perception.
Engagement Campaigns
Track these metrics to measure how audiences interact with and respond to influencer content:
Likes: Baseline indicator of content appreciation.
Comments: Reflects deeper engagement and sentiment; can be a strong indicator of community interest or feedback.
Shares: Shows content virality and how likely audiences are to spread your message.
Saves: Indicates content value, inspiration, or intent to revisit.
Story Replies / Poll Responses / Stickers: Shows active participation in short-form content (especially on Instagram Stories).
Video Views: Total plays across formats like Reels, TikToks, Stories, or YouTube.
Engagement Rate: Percentage of people who interacted with the content (likes, comments, shares, saves) out of those who saw it (impressions or reach) — key for comparing performance across influencers. Bonus: An easier way to calculate ER is through software. For example, Influencer Hero has a free Engagement Rate Calculator where, simply by adding the influencer’s handle, you have access to key data, including follower growth, fake followers analysis, and more!
Cost Per Engagement (CPE): The cost for each like, comment, share, or other engagement generated by the campaign — helps measure cost-effectiveness beyond just reach.
Customer Loyalty & Retention Campaigns
Track these metrics to measure the long-term value and ongoing relationship your influencer campaign builds with customers:
Customer Lifetime Value (CLV): The total value a customer brings to your brand over time.
Purchase Frequency: Average number of purchases per customer over a given period. Higher frequency = stronger retention and engagement.
Retention Time (Customer Lifespan): Average length of time a customer continues buying from your brand. Influencer campaigns that build emotional connection can extend this period.
Repeat Purchase Rate: Percentage of customers who return to make a second (or more) purchase.
Repeat Purchases: Number of customers who make multiple purchases after engaging with influencer content.
Churn Rate: Percentage of customers who stop buying from your brand over a given period. A lower churn rate after a campaign may indicate that influencer content successfully improved customer retention and brand loyalty.
Referrals: How often customers refer your brand to others, through affiliate links, discount codes, or word-of-mouth — a sign of brand advocacy and loyalty.
Improved Net Promoter Score (NPS): A measure of customer satisfaction and loyalty based on how likely customers are to recommend your brand.
CLV:CAC Ratio: The ratio of Customer Lifetime Value (CLV) to Customer Acquisition Cost (CAC). A higher ratio (ideally 3:1 or above) indicates that the value generated from retained customers significantly outweighs the cost of acquiring them, reflecting strong long-term profitability and successful retention efforts.
By setting clear KPIs, you create a measurable foundation for tracking performance and calculating ROI accurately.
Step 3: Track Costs Accurately
To calculate influencer marketing ROI correctly, it’s essential to get a complete and precise picture of your total investment, including both direct and indirect costs. Make sure to account for:
Influencer Compensation: Flat fees, commission-based payments, bonuses, and any other financial incentives paid to creators.
Gifted Products: Retail value of any gifted items, plus packaging and shipping expenses.
Paid Media Spend: Budget used to boost or repurpose influencer content through paid ads or promotions.
Platform or Agency Fees: Costs for influencer marketing platforms, management tools, or agency services supporting your campaign.
Internal Resources: Time and effort your team dedicates to outreach, coordination, reporting, and overall campaign management.
Keeping detailed and organized records of all these expenses — whether through budgeting software, spreadsheets, or project management tools — ensures your ROI calculations are accurate and helps you evaluate the true cost-efficiency of each campaign.
Step 4: Set Up Tracking Tools
Once your campaign goals, KPIs, and cost tracking are in place, the next step is selecting the right tools to collect, attribute, and analyze performance data. With the proper tracking systems, you can identify which collaborators are driving results, helping you decide who to reinvest in and who may not be the best fit for future campaigns.
Basic Tracking & Attribution
These tools directly link influencer actions to measurable results.
Promo Codes & Affiliate Links: Assign unique promo codes (e.g., “KAREN10”) or affiliate links embedded with UTM parameters to track redemptions, clicks, and conversions. When used, sales are attributed to the influencer, often earning them commissions. Influencer Hero, for example, supports affiliate group creation with different rules for each discount code: amount off products or orders, buy X get Y, free shipping. It also automates UTM link creation, allowing you to assign influencers personalized tracking links tied to specific product pages. Performance is then tracked directly in your dashboard.
Affiliate Platforms: Use platforms such as Refersion or ShareASale to automate the tracking of clicks, sales, and commissions.
Custom Landing Pages & Influencer Storefronts: Create influencer-specific landing pages or storefronts using Shopify, WooCommerce, or Creator Hero. These centralized promoted products showcase curated collections and streamline the user journey. When paired with UTM links and promo codes, they also enhance attribution by isolating influencer-driven traffic and conversions.
Analytics & Reporting
These advanced tools help interpret performance data and provide broader context for smarter decision-making.
Analytics Platforms & E-commerce Dashboards: Use platforms like Google Analytics and Shopify or WooCommerce to monitor influencer-driven website behavior, conversions (e.g., purchases, sign-ups, downloads), and revenue.
Influencer Marketing Software: Use platforms like Influencer Hero or Upfluence for end-to-end campaign tracking and reporting. They centralize influencer data, often integrating with analytics and e-commerce tools to automatically pull in metrics and provide a dashboard with influencer-specific insights.
CRM (Customer Relationship Management) Systems: Use platforms like HubSpot, Klaviyo or Dynamics 365 Sales from MS to monitor customer journeys, repeat purchases, and customer lifetime value (CLV)—essential for evaluating long-term campaign impact.
Social Media Insights and Brand Sentiment Tracking
These tools monitor native platform performance and how your brand is perceived online.
Native Social Analytics: Use built-in tools like Instagram Insights, TikTok Analytics, and YouTube Studio to track reach, engagement, follower growth, and content performance.If direct platform data isn’t accessible, request influencers to share screenshots of impressions, reach, or story views.
Social Listening Tools: Use platforms such as Brandwatch, Mention, Sprout Social, Google Trends, and Google Search Console to monitor brand mentions, hashtags, share of voice, and sentiment across social channels.
Matching Tools to Campaign Goals
Campaign Tracking Tools Table
Campaign Goal
Recommended Tracking Tools
Conversions / Sales
- UTM Parameters
- Promo Codes and Affiliate Links
- Custom Landing Pages and Storefronts
- Affiliate Platforms
- Google Analytics
- E-commerce Dashboards
- Influencer Marketing Platforms
Website Traffic
- UTM Parameters
- Custom Landing Pages and Storefronts
- Google Analytics
- E-commerce Traffic Reports
- Influencer Marketing Platforms
Brand Awareness
- Google Analytics
- Native Social Analytics
- Social Listening Tools
- Google Trends, Google Search Console
Engagement
- Native Social Analytics (including influencer-provided performance screenshots)
- Engagement rates tracked via influencer marketing platforms
Customer Loyalty & Retention
- Promo Codes and Affiliate Links
- E-commerce Dashboards
- CRM systems
- Post-campaign surveys
Pro Tip: Combine Multiple Tracking Methods for Maximum Accuracy
To get a comprehensive view of your influencer campaign’s performance, don’t rely on just one tracking method. Using multiple tools allows you to cross-verify data and understand how each influencer contributes at different stages of the funnel—ultimately providing a more accurate, data-backed view of ROI.
Step 5: Calculate Influencer Marketing ROI
Once you’ve gathered the relevant data using your tracking tools, it’s time to evaluate how your campaign performed. Remember: the way you calculate ROI will vary depending on your campaign goals
Campaign Metrics Table
Campaign Goal
Key Formula / Metric
Conversions / Sales
ROI (%) = (Revenue – Campaign Cost) / Campaign Cost × 100
CPA = Campaign Cost / Conversions
AOV = Total Revenue / Number of Orders
ROAS = Revenue from Ads / Ad Spend
Sales Growth (%) = (Post-Campaign Revenue – Pre-Campaign Revenue) / Pre-Campaign Revenue × 100
Website Traffic
CPC = Campaign Cost / Total Clicks
Cost per Session = Campaign Cost / Website Sessions
CPE = Campaign Cost / Total Engagements
Engagement Rate (%) = (Engagements / Impressions or Followers) × 100
Customer Loyalty & Retention
CLV = AOV × Purchase Frequency × Retention Time
ROI (%) = (Total CLV – Campaign Cost) / Campaign Cost × 100
Repeat Purchase Rate = Returning Customers / Total Campaign Customers
CLV:CAC Ratio = CLV / CAC
Conversions / Sales Campaigns
Use the standard ROI formula: ROI (%) = (Revenue from Campaign – Campaign Costs) / Campaign Costs × 100
Example: If you spent $10,000 and earned $40,000 in revenue:
ROI = (40,000 – 10,000) / 10,000 × 100 = 300%
The resulting percentage tells you how much return you generated for every dollar spent. In this case, you earned $3 for every $1 spent—a strong return on investment.
Also, a positive ROI means your campaign generated profit. A negative ROI means your costs outweighed your returns, and signals it may be time to optimize your strategy
Bonus KPIs to Track Alongside ROI
Conversion Rate = (Conversions / Clicks) × 100
Cost Per Acquisition (CPA) or Customer Acquisition Cost (CAC) = Total Campaign Cost / Number of Conversions
Average Order Value (AOV) = Total Revenue / Number of Orders
Return on Ad Spend (ROAS) = Revenue Attributed to Paid Campaign / Ad Spend
Sales Growth (Post-Campaign Lift) = (Revenue After Campaign – Revenue Before Campaign) / Revenue Before Campaign × 100
Important: Not All Sales Will Be Attributed
Expect some unattributed sales when using influencer affiliate links and promo codes. For example, if an influencer tags your brand’s social account instead of using their unique link, users may first visit your social profile and then click the general link in the bio to access your store. If your website displays a generic coupon code, customers might use that instead of the influencer's code, resulting in lost attribution.
Pro Tips:
Avoid displaying general discount codes on your website. This reduces confusion and strengthens trust with influencers, who rely on their unique codes to track referrals and earn commissions. When the same discount is available publicly, it can reduce motivation and negatively impact the partnership.
A good rule of thumb is that about one-third (30%) of your influencer-driven sales may be unattributed.
When budgeting, especially with flat-fee partnerships, build in a 30% buffer based on previous performance data to account for unattributed sales. This helps maintain your target ROAS or CAC, even with some attribution loss.
Website Traffic Campaigns
Use Cost Per Click (CPC) or Cost Per Visit/Session.
CPC = Campaign Costs / Total Clicks
Cost Per Session = Campaign Costs / Total Website Sessions
Example: If you spent $5,000 and got 2,000 sessions:
CPC = $5,000 / 2,000 = $2.50.
These metrics are especially useful when comparing influencer campaigns to paid ads or email campaigns.
Even without direct sales, high-quality traffic (e.g., longer session duration, more pages per session, lower bounce rate) can still be a strong signal of ROI—especially when influencer content is attracting and engaging the right audience more efficiently than other channels.
Bonus KPI to Track Alongside CPC:
Bounce Rate = Single-Page Sessions / Total Sessions × 100
Session Duration = Total Duration of All Sessions / Total Number of Sessions
Pages per Session = Total Pageviews / Total Sessions
Brand Awareness Campaigns
Use Cost Per Mille or Cost Per 1,000 Impressions (CPM).
CPM = (Campaign Costs / Total Impressions) × 1,000
This helps you compare influencer reach to paid advertising. For example, if your influencer campaign has a CPM of $6 and Meta Ads average $10 CPM, your influencer strategy is delivering cost-effective reach.
Bonus KPI to Track Alongside CPM: Earned Media Value (EMV)
EMV estimates how much it would cost to generate the same exposure through paid media — helping you assign a monetary value to organic influencer coverage.
EMV = (Total Impressions / 1,000) × Paid Media CPM
Example:
An influencer post earns 100,000 impressions. Your average CPM on paid channels is $20.
EMV = (100,000 / 1,000) × $20 = $2,000
This suggests the influencer post delivered $2,000 worth of exposure — a valuable benchmark for comparing ROI across channels.
Engagement Campaigns
Use Cost Per Engagement (CPE)
CPE = Campaign Costs / Total Engagements (likes, comments, shares, saves, and—depending on the platform—story replies or video views)
Compare your CPE to:
Past influencer campaign benchmarks
Industry averages (vary by niche and platform, but a common starting point is $0.05 to $0.30 per engagement)
Paid media performance
A low CPE paired with a high engagement rate is a strong indicator of high ROI.
Bonus KPI to Track Alongside CPE:Engagement Rate = (Total Engagements / Total Impressions or Followers) × 100
Customer Loyalty & Retention Campaigns
Use Customer Lifetime Value (CLV):
CLV = Average Order Value x Purchase Frequency x Retention Time, where:
Average Order Value = Total Revenue ÷ Number of Orders
Purchase Frequency = Total Orders ÷ Total Customers
Retention Time = Average number of years a customer continues buying from your brand
Example: $100 avg order x 3 times/year x 2 years = $600 CLTV
Then, estimate ROI Using the CLV Formula:
ROI (%) = [(Total CLV from Campaign - Campaign Cost) / Campaign Cost] × 100
Example:
Campaign Cost: $3,000
Retained Customers: 50
Average CLV: $200
Total CLV: 50 × $200 = $10,000
ROI: (10,000 - 3,000) ÷ 3,000 × 100 = 233%
Bonus KPI to Track Alongside CLV:
Repeat Purchase Rate = Returning Customers / Total Campaign Customers A higher repeat rate indicates better quality acquisition and retention impact.
CLV:CAC Ratio = CLV / Customer Acquisition Cost Aim for at least 3:1. For example, if CLV is $300 and CAC is $100, the ROI is healthy. Retention takes longer to track than conversions, but it’s crucial for understanding sustainable, long-term ROI from influencer efforts.
Pro Tip: Pair ROI metrics with Qualitative Signals
While quantitative ROI tells you what worked numerically, qualitative signals help explain why. Track things like:
Influencer content quality and reusability
Audience sentiment in comments, DMs, and customer reviews
Brand lift, including increases in search volume or social mentions
Feedback from internal teams or external partners
This holistic view will give you the clearest sense of what’s truly working and where to optimize next.
Step 6: Calculate ROI for Each Influencer
While Step 4 explains how to calculate overall campaign ROI, it’s also worth calculating ROI for each influencer. To do this, simply apply your chosen ROI formulas from Step 5 using each influencer’s specific performance data. This allows you to:
Compare influencer effectiveness and identify top performers
Optimize future campaigns with data-driven budget allocation
Identify high-performing content styles and audience engagement
Make informed decisions about long-term partnerships
Calculating ROI per influencer gives you a more detailed picture of your campaign’s true performance, helping you invest more in what works and improve what doesn’t.
Tip: In the Influencer Hero all-in-one marketing platform, brands can access a complete list of onboarded influencers ranked by performance. You can sort the list from highest to lowest or vice versa, based on impressions, clicks, Earned Media Value, and sales.
Step 7: Create Reports, Benchmark Results, and Optimize Future Campaigns
Once your campaign has concluded and ROI has been calculated, the next step is to consolidate your findings into a clear, actionable report. This documentation helps you identify what worked, what didn’t, and how to improve future efforts.
What to Include in Your Report:
Campaign Overview: Goals, timeline, budget, and platforms used
Influencer List: Who participated and what content they created
Key Performance Metrics: Reach, engagement, clicks, conversions, etc.
Content Highlights: Screenshots or links to standout posts and stories
ROI Breakdown: Overall ROI and per-influencer ROI for comparison
Insights: What performed well, what underperformed, and why
Recommendations: Next steps—e.g., A/B test different influencers, content types, or platforms
Recommended Tools:
Google Sheets or Airtable: For flexible, data-driven reporting
Canva or Notion: For visual storytelling and polished presentations
Influencer Platform Dashboards: For pulling performance data and automating metrics. Influencer Hero, for example, offers an automated reporting tool that will provide key insights, such as:
Influencers contacted, responded, onboarded, and posted.
Number of posts, followers reached, clicks, impressions, sales generated & Earned Media Value.
Payments processed during a selected time period.
List and amount of products sent, plus the total product cost during the desired time period.
This final step ensures that you’re not only tracking ROI but also learning from it, so each campaign is smarter and more effective than the last.
Naked Wines ran a gifting campaign focused on brand awareness on Instagram and YouTube, onboarding 481 influencers with 371 posting content—a posting rate of approximately 77%. The campaign reached 31 million followers and generated 5 million impressions with an Earned Media Value (EMV) of $99.9K. This large-scale activation helped significantly boost visibility, strengthen brand positioning, and generate a strong volume of authentic user-generated content for future use.
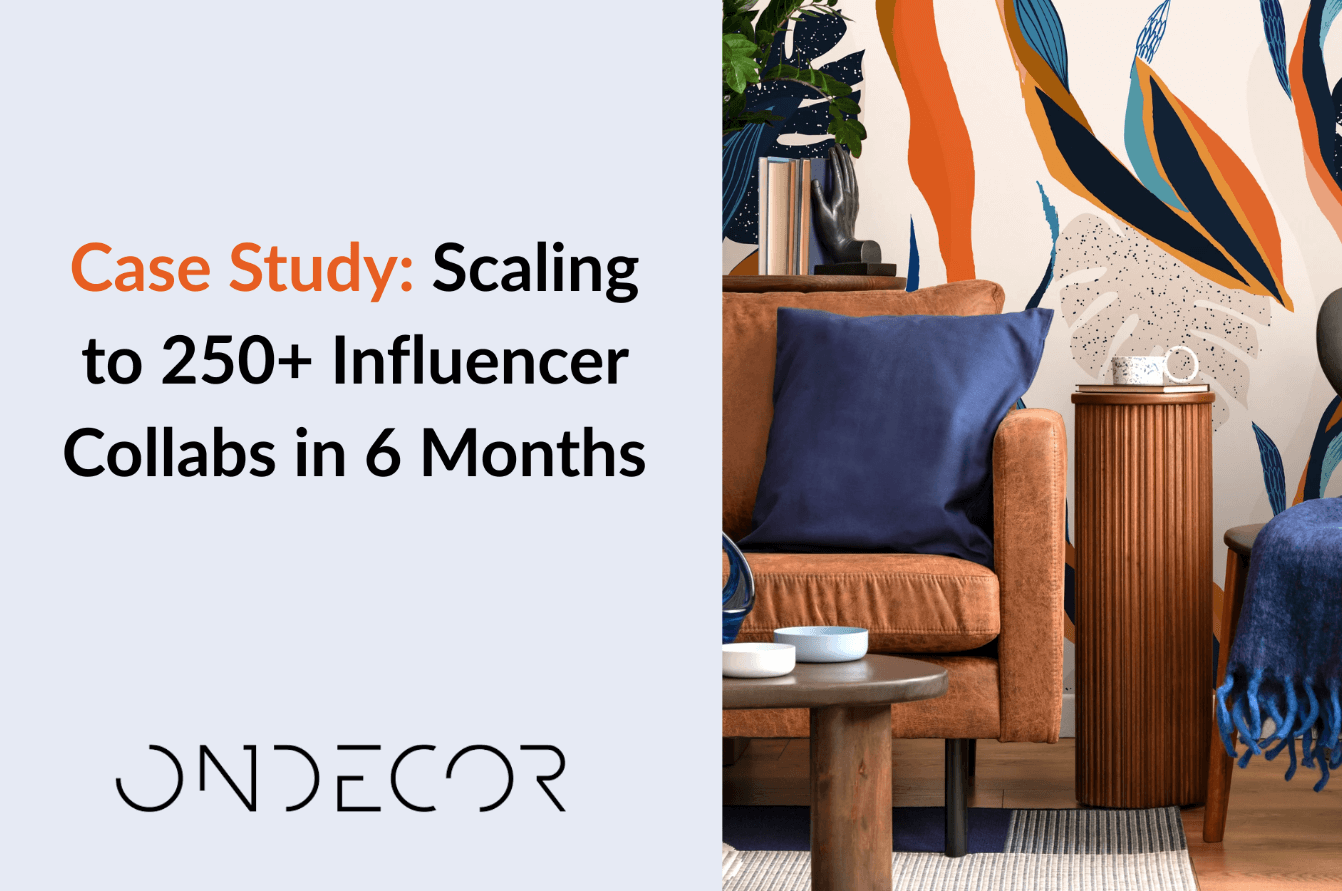
OndeCor executed over 270 influencer collaborations, generating more than 1.3 million impressions and $37.6K in Earned Media Value (EMV). The campaign produced 360+ high-quality user-generated content pieces, including Reels, Feed Posts, and Stories, which were repurposed for ongoing brand campaigns and Meta ads.
Additionally, 35 top-performing influencers were re-engaged for seasonal and ongoing campaigns, helping to strengthen long-term ROI and deepen brand affinity.
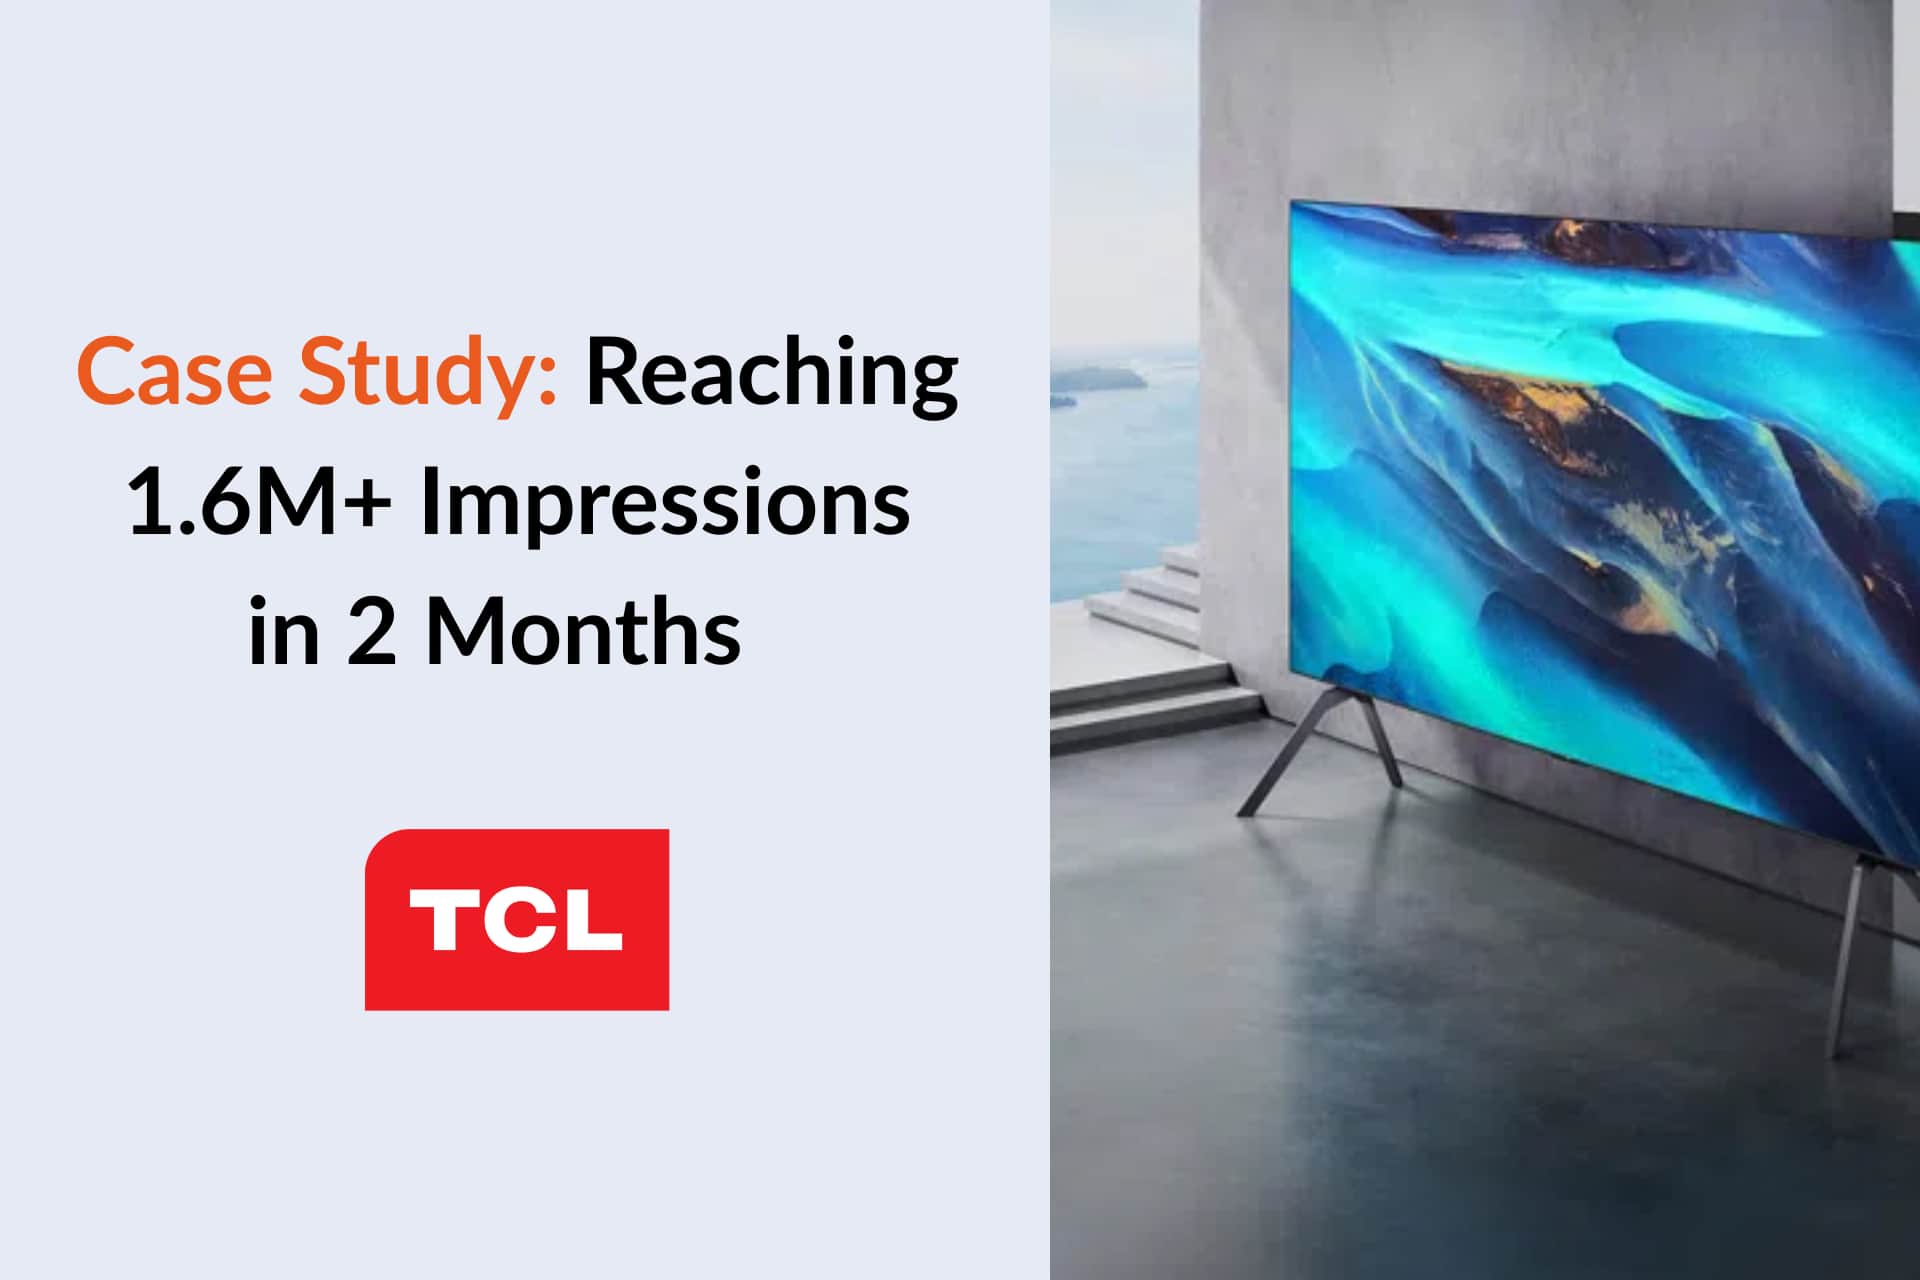
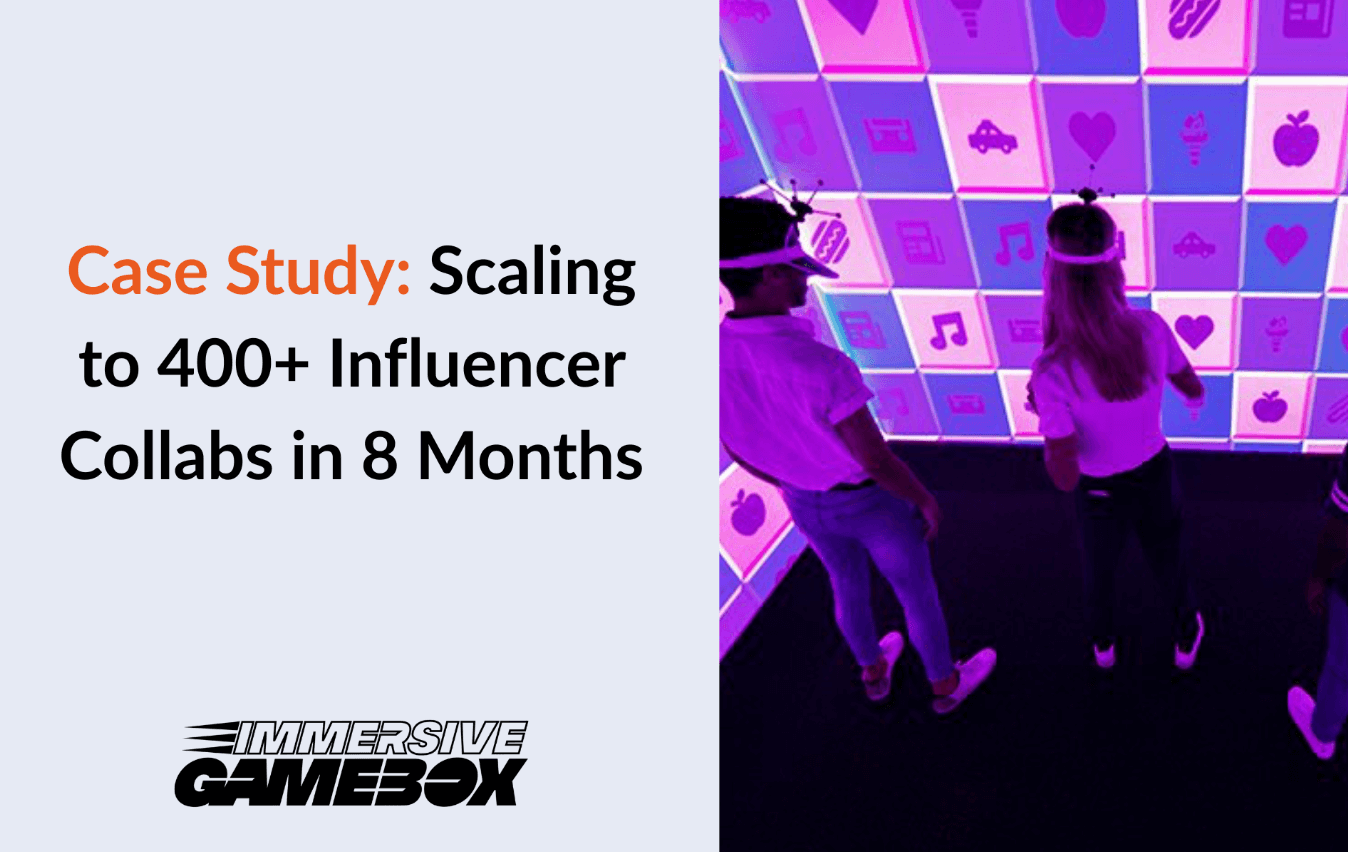
Immersive Gamebox ran a multi-city influencer campaign focused on brand awareness and venue promotion. They collaborated with over 400 influencers on Instagram and TikTok, generating 1.6 million impressions and an estimated $28.8K in Earned Media Value (EMV). The campaign reached over 12 million followers across 25 U.S. and U.K. cities, producing 300+ pieces of high-quality, repurposable UGC. More than 50 top-performing influencers were re-engaged for future collaborations.
Final Thoughts On How To Track Influencer Marketing ROI
Tracking influencer marketing ROI is essential for understanding whether your efforts are delivering meaningful results. By setting clear goals, monitoring the right KPIs, analyzing performance, and considering long-term value, you can accurately measure impact, justify your investment, and improve future campaigns.
The key takeaway? Your definition of “return” should reflect your campaign goals. ROI isn’t just about revenue — it’s about impact. Aligning your objectives with the right metrics and tools is what ultimately leads to better performance and smarter marketing decisions.
How often should I review influencer ROI during and after a campaign?
Review ROI weekly or bi-weekly during the campaign to make real-time optimizations, like reallocating budget or boosting top-performing content. After the campaign, wait 7–30 days to assess full impact and account for delayed conversions, especially for higher-consideration purchases.
What should I do if ROI is low but engagement is high?
High engagement can signal strong brand interest even without immediate sales. Retarget engaged users with offers, refine your landing pages, or nurture the influencer relationship for future potential.
What’s the best way to measure ROI for small businesses (without paid tools)?
Use trackable promo codes or UTM links to measure clicks and conversions. Combine with free tools like Google Analytics and native insights from Instagram, TikTok, or YouTube for a cost-effective ROI setup.
Can influencer ROI vary across platforms?
Yes, ROI depends on your campaign goal and how your audience behaves on each platform. TikTok often drives strong awareness and engagement, Instagram is effective for conversions and link clicks, and YouTube tends to perform well for long-form storytelling, product education, and sustained viewer trust, often leading to higher-value conversions over time.
What if an influencer doesn’t generate sales?
Sales aren’t the only indicator of value. Look at engagement rates, content quality, and audience reach. Influencers with high engagement may still be worth investing in with retargeting ads or future campaigns.